3
$\begingroup$

I am new to Mathematica and I tried searching the docs but no specific examples there.

This is what I have achieved so far, returns an error, probably wrong syntax.

Plot[ Sin[x], {x, 0, 2 Pi}, Filling -> Range {x, 0, Pi}]
$\endgroup$
5
  • $\begingroup$ Try Plot[{If[0 < x < Pi, Sin[x]], Sin[x]}, {x, 0, 2 Pi}, Filling -> {1 -> Axis}] For area take a look at Integrate. $\endgroup$
    – Kuba
    Commented Jan 20, 2014 at 14:53
  • $\begingroup$ To get the area: Integrate[Sin[x], {x, 0, Pi}] $\endgroup$
    – bill s
    Commented Jan 20, 2014 at 14:55
  • $\begingroup$ Thanks @Kuba, and bills: I need a single value for the area. Anyway, can Mathematica could do this automatically, with a special function that allows me to integrate and in the process, it does the shade. $\endgroup$
    – Ali Gajani
    Commented Jan 20, 2014 at 15:03
  • $\begingroup$ What do you mean by "in the process"? Do you want an animated graphics with shading increasing along time and some text indicating the area of current shaded region? $\endgroup$
    – Silvia
    Commented Jan 27, 2014 at 20:27
  • $\begingroup$ To the close voters: how is this easily found in the documentation? The OP did not merely ask how to compute the area under the curve, but how to do it "in the process" of plotting. I believe my answer describes this, and I cannot recall seeing that in the documentation. $\endgroup$
    – Mr.Wizard
    Commented Jan 28, 2014 at 5:58

3 Answers 3

6
$\begingroup$

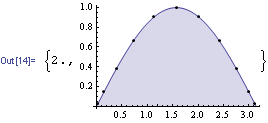
No, there is no "special function that allows me to integrate and in the process, it does the shade", but you can shade the area and plot the points used in the integration. For example:

f[x_?NumericQ] := Sow[{x, Sin[x]}][[2]]
{#[[1]], Plot[f@x, {x, 0, Pi}, Epilog -> Point@#[[2]], 
              Filling -> Axis]} &@Reap@NIntegrate[f[x], {x, 0, Pi}]
Mathematica graphics

$\endgroup$
9
  • $\begingroup$ Thanks, but getting an error. SetDelayed::write: Tag InterpolatingFunction in <<1>>[x_?NumericQ] is Protected. >> and InterpolatingFunction::dmval: "Input value {0.0000641782} lies outside the range of data in the interpolating function. Extrapolation will be used." $\endgroup$
    – Ali Gajani
    Commented Jan 20, 2014 at 15:42
  • $\begingroup$ @AliGajani Restart your Mathematica session and try again $\endgroup$ Commented Jan 20, 2014 at 15:43
  • $\begingroup$ Same @belisarius :( Anyway, how come I use NIntegrate on sinx and it won't reveal -cos x but some random pile of numbers. I'd love some guidance in this regard as well. Thank you. $\endgroup$
    – Ali Gajani
    Commented Jan 20, 2014 at 15:47
  • 2
    $\begingroup$ Belisaius code works fine. Copy/paste it and choose Evaluation->Quit Kernel->Local to remove previous definitions (that are causing the errors). Use Integrate instead of NIntegrate if you want it done symbolically rather than numerically. $\endgroup$
    – bill s
    Commented Jan 20, 2014 at 16:01
  • 1
    $\begingroup$ @AliGajani, I think you are looking for the indefinite integral Integrate[Sin[x], x]. You may benefit from reading the documentation for Integrate, perhaps start here: How to Do an Integral $\endgroup$ Commented Jan 20, 2014 at 17:08
5
$\begingroup$

I don't really understand the question but you can try this:

Manipulate[Plot[{Sin[x], Sin[x] Boole[x < y]}, {x, 0, Pi}, 
    Filling -> 2 -> Axis, Frame -> True, 
    ImageSize -> 500, Epilog -> Inset[NIntegrate[Sin[x], 
      {x, 0, y}], {y, 1/2 Sin[y]}, {Right, Center}]], {y, 0, Pi}
]
$\endgroup$
0
5
$\begingroup$

Taking the question at face value: you can calculate the area of the fill from the Graphics object that is generated by Plot, specifically the Polygon expression.

I will use this fill method and my old polyarea code.

The plot:

gr = Plot[{If[x < Pi, Sin[x]], Sin[x]}, {x, 0, 2 Pi}, Filling -> {1 -> Axis}]
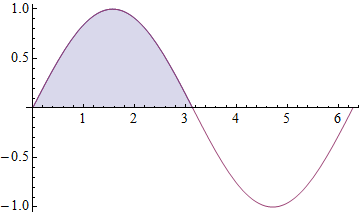
enter image description here

The area:

polyarea = 
  Compile[{{v, _Real, 2}}, 
   Block[{x, y}, {x, y} = Transpose@v; 
    Abs[x.RotateLeft@y - [email protected]]/2]];

Cases[Normal @ gr, Polygon[a_?ArrayQ] :> polyarea[a], {-4}]
{1.99894}

Normal is needed to convert the GraphicsComplex data into plain coordinate data.

Additional Plot precision will yield additional numeric precision:

gr = Plot[{If[x < Pi, Sin[x]], Sin[x]}, {x, 0, 2 Pi},
      Filling -> {1 -> Axis}, 
      Method -> {MaxBend -> 0.5}];

Cases[Normal @ gr, Polygon[a_?ArrayQ] :> polyarea[a], {-4}]
{1.99998}

For a function that crosses the axis you will need to account for the sign. For example:

Plot[Re[Zeta[1/2 + I t]], {t, -7, 20}, Filling -> Axis, Method -> {MaxBend -> 0.2}]

Cases[Normal @ %, Polygon[a_?ArrayQ] :> Sign@Last@Mean@a * polyarea@a, {-4}]

Total @ %
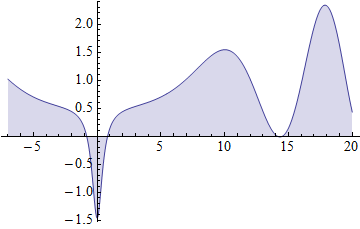
enter image description here

{-0.00312878, -1.15988, 7.2798, 3.74814, 11.4189}

21.2838

Confirmation of the area calculated with NIntegrate:

NIntegrate[Re[Zeta[1/2 + I t]], {t, -7, 20}]
21.2838
$\endgroup$

Your Answer

By clicking “Post Your Answer”, you agree to our terms of service and acknowledge you have read our privacy policy.

Not the answer you're looking for? Browse other questions tagged or ask your own question.