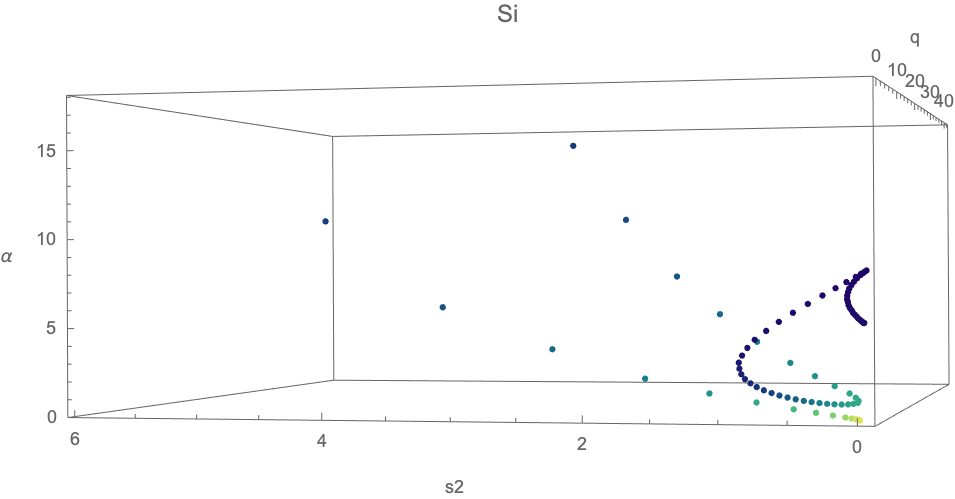
I have been trying make a plot that I have with ListPointPlot3D into a line plot instead of a point plot. I wish there was something called ListLinePlot3D. I've seen examples with,
/.Point-> Line
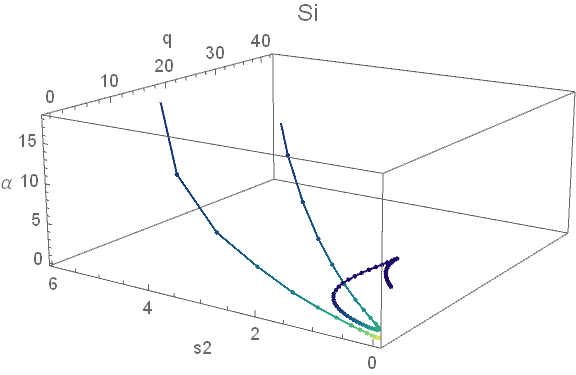
,after the code but it just returns a blank graph for me. What is going on? Here is a picture of the graph thus far. I've been able to use this "trick" for other plots just fine but I'm wondering if it has to do with the fact that in this context I have a "4d" plot (3D + color).
   normdSi =
  Table[(p - Min[Sidata1[[All, 2]]])/(Max[Sidata1[[All, 2]]] -
      Min[Sidata1[[All, 2]]]), {p, Sidata1[[All, 2]]}];
colorsSi = Table[ColorData["BlueGreenYellow"][d], {d, normdSi}];
Si4dplot =
 ListPointPlot3D[{#[[3 ;; 5]]} & /@ Sidata1, PlotStyle -> colorsSi,
  AxesLabel -> {"q", "s2", "\[Alpha]"}, ImageSize -> Full,
  LabelStyle -> {18}, PlotLabel -> Style["Si", 24]]/.Point->Line
Here is my data. It has 5 columns with 201 rows.
{{0, 0.00586554, 1.85613, 4.76551*10^-28, 5.26926}, {1, 0.00586038,
  1.85857, 0.00496208, 5.26553}, {2, 0.00583292, 1.86694, 0.00737286,
  5.28264}, {3, 0.00578611, 1.88105, 0.00995626, 5.31438}, {4,
  0.00572788, 1.90041, 0.0195179, 5.34518}, {5, 0.0056491, 1.92576,
  0.026371, 5.3971}, {6, 0.00555664, 1.95654, 0.0357567, 5.4579}, {7,
  0.005454, 1.99256, 0.0488175, 5.52469}, {8, 0.00533414, 2.03443,
  0.0587529, 5.61315}, {9, 0.00520924, 2.08121, 0.0728039,
  5.70511}, {10, 0.00507624, 2.13333, 0.0868532, 5.80991}, {11,
  0.00493048, 2.19114, 0.0969574, 5.937}, {12, 0.00479085, 2.25265,
  0.111276, 6.06199}, {13, 0.00464483, 2.31891, 0.12169,
  6.20612}, {14, 0.00449348, 2.3895, 0.12767, 6.36945}, {15,
  0.00435635, 2.46022, 0.134399, 6.52873}, {16, 0.00421573, 2.53408,
  0.13467, 6.70861}, {17, 0.00408066, 2.60798, 0.130038,
  6.89764}, {18, 0.003962, 2.67731, 0.122165, 7.08088}, {19,
  0.0038446, 2.74659, 0.107359, 7.27855}, {20, 0.0037445, 2.80767,
  0.0891022, 7.46372}, {21, 0.00366125, 2.85969, 0.0685708,
  7.63264}, {22, 0.00358362, 2.90781, 0.0439095, 7.80201}, {23,
  0.00353606, 2.93743, 0.0254055, 7.91445}, {24, 0.00350441, 2.9569,
  0.0112019, 7.99332}, {25, 0.00348267, 2.96992, 4.2709*10^-28,
  8.05004}, {26, 0.00350619, 2.95655, 0.0140871, 7.98594}, {27,
  0.00354397, 2.9359, 0.0380519, 7.88204}, {28, 0.0036054, 2.90368,
  0.077481, 7.71557}, {29, 0.00371579, 2.84915, 0.145356,
  7.43302}, {30, 0.00384706, 2.78696, 0.22453, 7.10949}, {31,
  0.00402225, 2.70695, 0.319264, 6.71886}, {32, 0.00425262, 2.60492,
  0.42526, 6.26836}, {33, 0.00451347, 2.4927, 0.533519, 5.80028}, {34,
   0.00484984, 2.35888, 0.635259, 5.31261}, {35, 0.0052487, 2.21331,
  0.726175, 4.82797}, {36, 0.00569123, 2.06324, 0.807586,
  4.35526}, {37, 0.00625698, 1.90488, 0.858761, 3.92207}, {38,
  0.00689091, 1.74683, 0.894649, 3.51698}, {39, 0.00759815, 1.59081,
  0.915479, 3.14207}, {40, 0.00847396, 1.44051, 0.907596,
  2.82513}, {41, 0.00943069, 1.29475, 0.890287, 2.53427}, {42,
  0.0105185, 1.15519, 0.860229, 2.27889}, {43, 0.0117991, 1.02388,
  0.81632, 2.06547}, {44, 0.0131859, 0.897942, 0.767916,
  1.87227}, {45, 0.0147797, 0.780792, 0.713042, 1.70999}, {46,
  0.0165753, 0.670983, 0.65441, 1.57258}, {47, 0.0184995, 0.565447,
  0.594737, 1.44957}, {48, 0.0207039, 0.467657, 0.533712,
  1.35086}, {49, 0.0230828, 0.374668, 0.47279, 1.26641}, {50,
  0.025591, 0.285255, 0.412327, 1.1928}, {51, 0.0283735, 0.201725,
  0.353629, 1.13931}, {52, 0.0312372, 0.119185, 0.295722,
  1.09523}, {53, 0.0341712, 0.0377658, 0.238978, 1.06272}, {54,
  0.0370919, -0.0411159, 0.184837, 1.04753}, {55, 0.03991, -0.118284,
  0.132156, 1.04359}, {56, 0.0424219, -0.189196, 0.0842067,
  1.05721}, {57, 0.0443678, -0.245829, 0.0451427, 1.09405}, {58,
  0.0458307, -0.287877, 0.0134487, 1.15053}, {59,
  0.0461722, -0.273939, 0.00724523, 1.25192}, {60, 0.04547, -0.189799,
   0.029489, 1.40789}, {61, 0.0439536, -0.040825, 0.0760268,
  1.61787}, {62, 0.0410509, 0.287135, 0.188407, 1.98092}, {63,
  0.0374884, 0.737128, 0.339519, 2.48104}, {64, 0.0334165, 1.32035,
  0.529929, 3.15253}, {65, 0.0292259, 2.16715, 0.792678,
  4.24807}, {66, 0.0249774, 3.20952, 1.09423, 5.70677}, {67,
  0.0209618, 4.54328, 1.4547, 7.76466}, {68, 0.0175535, 6.37734,
  1.90226, 10.9599}, {69, 0.0142979, 8.71509, 2.3962, 15.3082}, {70,
  0.0116484, 11.9196, 2.96614, 21.8363}, {71, 0.00952234, 16.4455,
  3.46263, 31.8198}, {72, 0.00756156, 22.4422, 3.69173, 45.7099}, {73,
   0.00637376, 29.2974, 3.10612, 62.8753}, {74, 0.00557852, 35.9338,
  1.7877, 80.5131}, {75, 0.0050232, 41.7985, 8.59236*10^-27,
  96.93}, {76, 0.00564134, 35.4285, 2.17511, 78.8748}, {77,
  0.00664996, 27.396, 4.4568, 56.9122}, {78, 0.00830127, 18.7827,
  5.93387, 34.9235}, {79, 0.0112518, 12.1619, 5.34133, 20.6996}, {80,
  0.0147477, 7.27342, 4.38667, 11.0649}, {81, 0.0192714, 4.31069,
  3.28923, 6.07815}, {82, 0.0249166, 2.64861, 2.36017, 3.78892}, {83,
  0.0310646, 1.44104, 1.61259, 2.25868}, {84, 0.038089, 0.763281,
  1.11354, 1.51843}, {85, 0.0455155, 0.323334, 0.756884,
  1.08172}, {86, 0.0530392, -0.00833097, 0.480004, 0.764547}, {87,
  0.0602388, -0.191606, 0.314908, 0.599}, {88, 0.0669456, -0.322307,
  0.19112, 0.476188}, {89, 0.0729913, -0.407595, 0.101166,
  0.385506}, {90, 0.0773187, -0.422702, 0.0563086, 0.338125}, {91,
  0.0808823, -0.415833, 0.0252911, 0.301559}, {92,
  0.0833385, -0.387366, 0.00888385, 0.276938}, {93,
  0.0845245, -0.347873, 0.00355736, 0.262038}, {94,
  0.085323, -0.310296, 0.000716217, 0.249179}, {95,
  0.0854916, -0.278922, 0.00021299, 0.239806}, {96,
  0.0853257, -0.253975, 0.000358958, 0.232963}, {97,
  0.0851545, -0.232974, 0.000267074, 0.227071}, {98,
  0.0848481, -0.218693, 0.000354803, 0.223956}, {99,
  0.084646, -0.209427, 0.000303089, 0.222006}, {100,
  0.0846189, -0.204535, 3.2539*10^-31, 0.220639}, {101,
  0.084646, -0.209427, 0.000303089, 0.222006}, {102,
  0.0848481, -0.218693, 0.000354803, 0.223956}, {103,
  0.0851545, -0.232974, 0.000267074, 0.227071}, {104,
  0.0853257, -0.253975, 0.000358958, 0.232963}, {105,
  0.0854916, -0.278922, 0.00021299, 0.239806}, {106,
  0.085323, -0.310296, 0.000716217, 0.249179}, {107,
  0.0845245, -0.347873, 0.00355736, 0.262038}, {108,
  0.0833385, -0.387366, 0.00888385, 0.276938}, {109,
  0.0808823, -0.415833, 0.0252911, 0.301559}, {110,
  0.0773187, -0.422702, 0.0563086, 0.338125}, {111,
  0.0729913, -0.407595, 0.101166, 0.385506}, {112,
  0.0669456, -0.322307, 0.19112, 0.476188}, {113,
  0.0602388, -0.191606, 0.314908, 0.599}, {114,
  0.0530392, -0.00833097, 0.480004, 0.764547}, {115, 0.0455155,
  0.323334, 0.756884, 1.08172}, {116, 0.038089, 0.763281, 1.11354,
  1.51843}, {117, 0.0310646, 1.44104, 1.61259, 2.25868}, {118,
  0.0249166, 2.64861, 2.36017, 3.78892}, {119, 0.0192714, 4.31069,
  3.28923, 6.07815}, {120, 0.0147477, 7.27342, 4.38667,
  11.0649}, {121, 0.0112518, 12.1619, 5.34133, 20.6996}, {122,
  0.00830127, 18.7827, 5.93387, 34.9235}, {123, 0.00664996, 27.396,
  4.4568, 56.9122}, {124, 0.00564134, 35.4285, 2.17511,
  78.8748}, {125, 0.0050232, 41.7985, 5.2584*10^-27, 96.93}, {126,
  0.00557852, 35.9338, 1.7877, 80.5131}, {127, 0.00637376, 29.2974,
  3.10612, 62.8753}, {128, 0.00756156, 22.4422, 3.69173,
  45.7099}, {129, 0.00952234, 16.4455, 3.46263, 31.8198}, {130,
  0.0116484, 11.9196, 2.96614, 21.8363}, {131, 0.0142979, 8.71509,
  2.3962, 15.3082}, {132, 0.0175535, 6.37734, 1.90226, 10.9599}, {133,
   0.0209618, 4.54328, 1.4547, 7.76466}, {134, 0.0249774, 3.20952,
  1.09423, 5.70677}, {135, 0.0292259, 2.16715, 0.792678,
  4.24807}, {136, 0.0334165, 1.32035, 0.529929, 3.15253}, {137,
  0.0374884, 0.737128, 0.339519, 2.48104}, {138, 0.0410509, 0.287135,
  0.188407, 1.98092}, {139, 0.0439536, -0.040825, 0.0760268,
  1.61787}, {140, 0.04547, -0.189799, 0.029489, 1.40789}, {141,
  0.0461722, -0.273939, 0.00724523, 1.25192}, {142,
  0.0458307, -0.287877, 0.0134487, 1.15053}, {143,
  0.0443678, -0.245829, 0.0451427, 1.09405}, {144,
  0.0424219, -0.189196, 0.0842067, 1.05721}, {145, 0.03991, -0.118284,
   0.132156, 1.04359}, {146, 0.0370919, -0.0411159, 0.184837,
  1.04753}, {147, 0.0341712, 0.0377658, 0.238978, 1.06272}, {148,
  0.0312372, 0.119185, 0.295722, 1.09523}, {149, 0.0283735, 0.201725,
  0.353629, 1.13931}, {150, 0.025591, 0.285255, 0.412327,
  1.1928}, {151, 0.0230828, 0.374668, 0.47279, 1.26641}, {152,
  0.0207039, 0.467657, 0.533712, 1.35086}, {153, 0.0184995, 0.565447,
  0.594737, 1.44957}, {154, 0.0165753, 0.670983, 0.65441,
  1.57258}, {155, 0.0147797, 0.780792, 0.713042, 1.70999}, {156,
  0.0131859, 0.897942, 0.767916, 1.87227}, {157, 0.0117991, 1.02388,
  0.81632, 2.06547}, {158, 0.0105185, 1.15519, 0.860229,
  2.27889}, {159, 0.00943069, 1.29475, 0.890287, 2.53427}, {160,
  0.00847396, 1.44051, 0.907596, 2.82513}, {161, 0.00759815, 1.59081,
  0.915479, 3.14207}, {162, 0.00689091, 1.74683, 0.894649,
  3.51698}, {163, 0.00625698, 1.90488, 0.858761, 3.92207}, {164,
  0.00569123, 2.06324, 0.807586, 4.35526}, {165, 0.0052487, 2.21331,
  0.726175, 4.82797}, {166, 0.00484984, 2.35888, 0.635259,
  5.31261}, {167, 0.00451347, 2.4927, 0.533519, 5.80028}, {168,
  0.00425262, 2.60492, 0.42526, 6.26836}, {169, 0.00402225, 2.70695,
  0.319264, 6.71886}, {170, 0.00384706, 2.78696, 0.22453,
  7.10949}, {171, 0.00371579, 2.84915, 0.145356, 7.43302}, {172,
  0.0036054, 2.90368, 0.077481, 7.71557}, {173, 0.00354397, 2.9359,
  0.0380519, 7.88204}, {174, 0.00350619, 2.95655, 0.0140871,
  7.98594}, {175, 0.00348267, 2.96992, 4.34023*10^-27, 8.05004}, {176,
   0.00350441, 2.9569, 0.0112019, 7.99332}, {177, 0.00353606, 2.93743,
   0.0254055, 7.91445}, {178, 0.00358362, 2.90781, 0.0439095,
  7.80201}, {179, 0.00366125, 2.85969, 0.0685708, 7.63264}, {180,
  0.0037445, 2.80767, 0.0891022, 7.46372}, {181, 0.0038446, 2.74659,
  0.107359, 7.27855}, {182, 0.003962, 2.67731, 0.122165,
  7.08088}, {183, 0.00408066, 2.60798, 0.130038, 6.89764}, {184,
  0.00421573, 2.53408, 0.13467, 6.70861}, {185, 0.00435635, 2.46022,
  0.134399, 6.52873}, {186, 0.00449348, 2.3895, 0.12767,
  6.36945}, {187, 0.00464483, 2.31891, 0.12169, 6.20612}, {188,
  0.00479085, 2.25265, 0.111276, 6.06199}, {189, 0.00493048, 2.19114,
  0.0969574, 5.937}, {190, 0.00507624, 2.13333, 0.0868532,
  5.80991}, {191, 0.00520924, 2.08121, 0.0728039, 5.70511}, {192,
  0.00533414, 2.03443, 0.0587529, 5.61315}, {193, 0.005454, 1.99256,
  0.0488175, 5.52469}, {194, 0.00555664, 1.95654, 0.0357567,
  5.4579}, {195, 0.0056491, 1.92576, 0.026371, 5.3971}, {196,
  0.00572788, 1.90041, 0.0195179, 5.34518}, {197, 0.00578611, 1.88105,
   0.00995626, 5.31438}, {198, 0.00583292, 1.86694, 0.00737286,
  5.28264}, {199, 0.00586038, 1.85857, 0.00496208, 5.26553}, {200,
  0.00586554, 1.85613, 4.76551*10^-28, 5.26926}}
EDIT
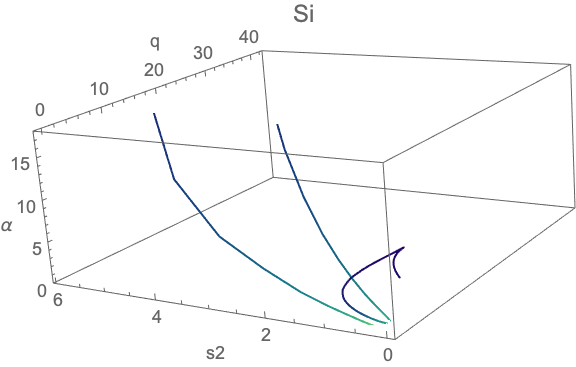
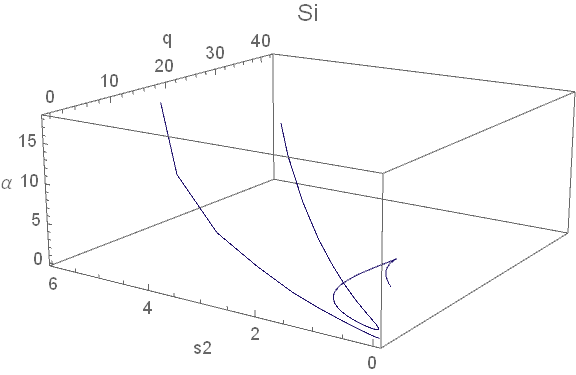
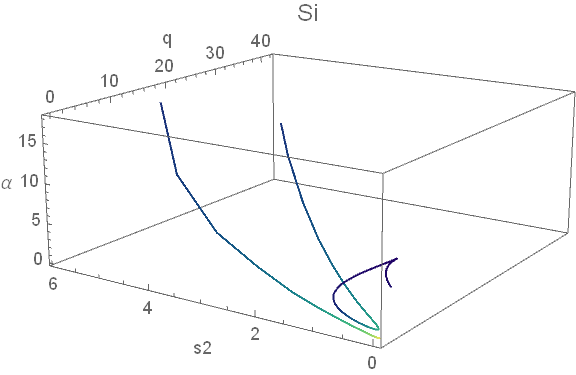
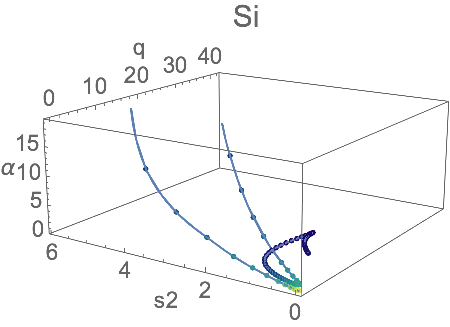
I tried using your response and this is what I have written in my code. But this is the plot that I am getting. The yellowish points aren't there?
normdSi =
  Table[(p - Min[Sidata1[[All, 2]]])/(Max[Sidata1[[All, 2]]] -
      Min[Sidata1[[All, 2]]]), {p, Sidata1[[All, 2]]}];
colorsSi = Table[ColorData["BlueGreenYellow"][d], {d, normdSi}];
lpp3d1 = ListPointPlot3D[{#[[3 ;; 5]]} & /@ Sidata1,
   PlotStyle -> colorsSi, AxesLabel -> {"q", "s2", "\[Alpha]"},
   ImageSize -> Large, LabelStyle -> {18},
   PlotLabel -> Style["Si", 24], ViewPoint -> {-3, -2, 1}];
lpp3d1 /.
 points : {{Directive[_, _], Point[_]} ..} :> {Thick,
   Line[points[[All, 2, 1, 1]], VertexColors -> points[[All, 1, 2]]]}

InterpolationandParametricPlot3Dsolution from here. $\endgroup$