0
$\begingroup$

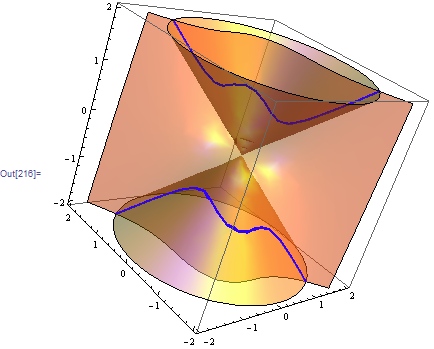
Say I have two polynomials in $\mathbb{R}[X,Y,Z]$, whose intersection of zero loci correspond to a curve in the 3D space.

What is the best way to plot the curve?

Example:

$$ f = X^2+Y^2-Z^2, \qquad g = 2X^3+Y^3-Z $$ I want to plot the curve given by $$ \begin{cases} &X^2+Y^2=Z^2 \\\\ &2X^3+Y^3=Z \end{cases} $$

$\endgroup$
0

1 Answer 1

6
$\begingroup$

Directly from Highlight the Intersection of Two Surfaces

Is this what you are looking for?

h = x^2 + y^2 - z^2;
g = 2 x^3 + y^3 - z;
ContourPlot3D[{h == 0, g == 0}, {x, -2, 2}, {y, -2, 2}, {z, -2, 2}, 
   MeshFunctions -> {Function[{x, y, z, f}, h - g]}, 
 MeshStyle -> {{Thick, Blue}}, Mesh -> {{0}}, ContourStyle -> Directive[Orange, 
  Opacity[0.5], Specularity[White, 30]]]

Mathematica graphics

$\endgroup$
1
  • $\begingroup$ Nice. How to do the same but with intersections of parallel planes with coordinate planes. $\endgroup$
    – Sigur
    Commented Mar 25, 2014 at 23:21

Not the answer you're looking for? Browse other questions tagged or ask your own question.