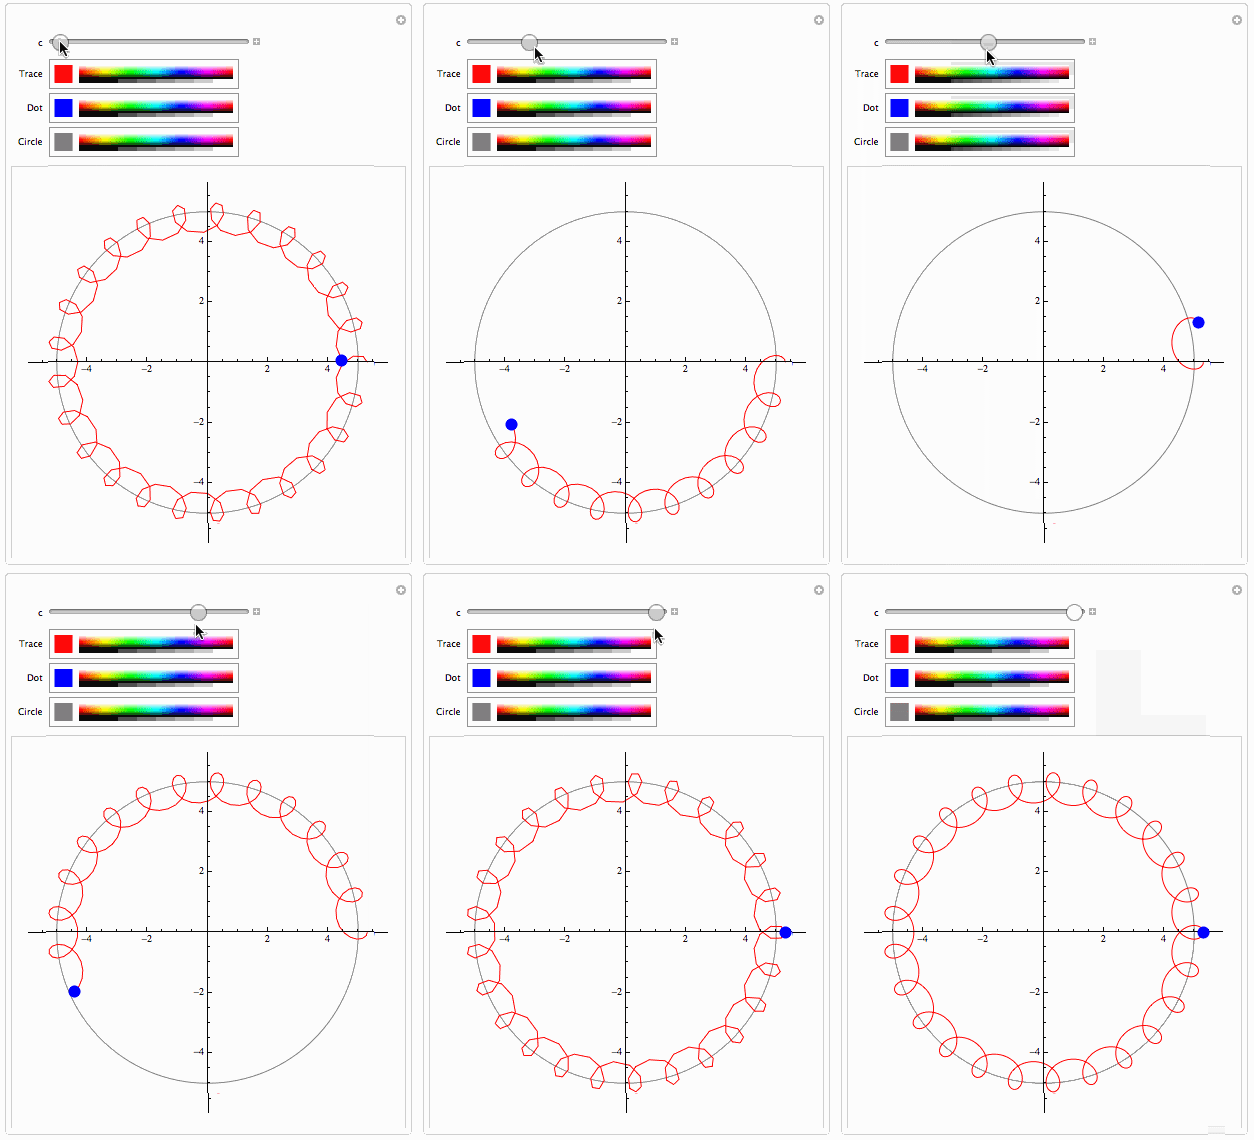
I want to make my function trace the hypotrochoid through one period of its motion and trying to change the color of the trace, color of the radius, and change the color of the dot on it so I can view it easier
I have came up with this following function
 hypotrochoid[a_, b_, h_,t_] := {(a - b) Cos[t] + h Cos[(a - b)/b t], (a - b) Sin[t] -
h Sin[(a - b)/b t]};

 myfigure[a_, b_, h_]:=Manipulate[ParametricPlot[hypotrochoid[a, b, h, t], {t, 0, c*2 \[Pi]},PlotRange -> {{-(a + b + h + 1/4), a + b + h + 1/4}, {-(a + b + h + 1/4), a + b + h + 1/4}}], {c, -1, 1}]
Though when I test it on
myfigure[5, 1, 1/2]
Nothing shows up on this testing. I know I do not have the coloring but not certain of the syntax require.


hypotrochoid? $\endgroup$