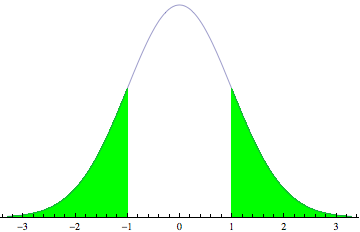
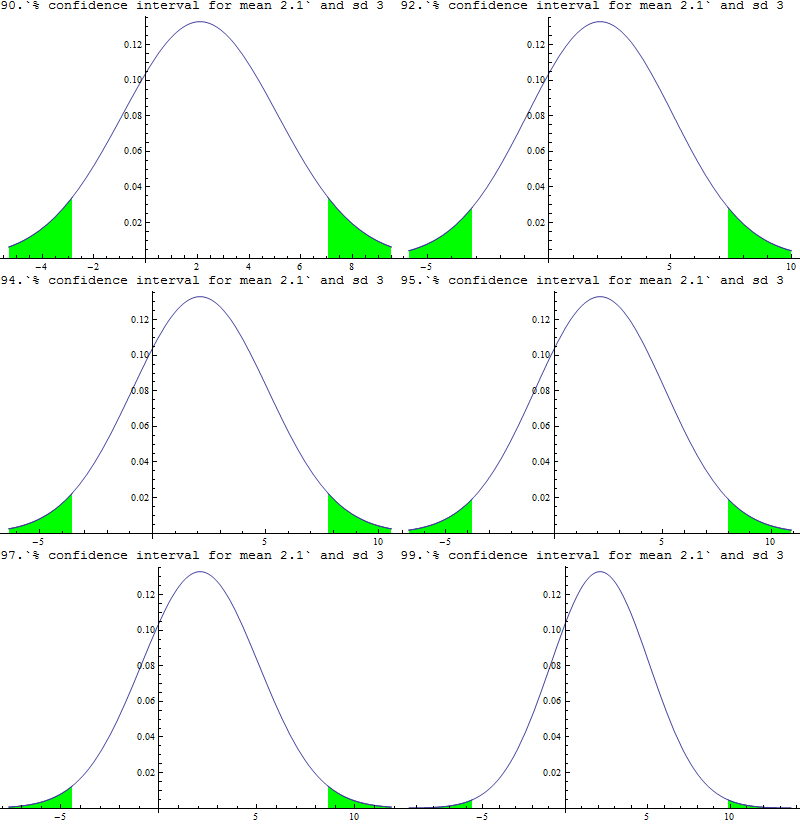
The documentation for PDF has an example for plotting a confidence interval of a standard normal distribution:
pdf = PDF[NormalDistribution[], x]
Show[Plot[pdf, {x, -1.7, -1}, Filling -> Axis, FillingStyle -> Green],
  Plot[pdf, {x, -1, 1}] ,
 Plot[pdf, {x, 1, 1.7}, Filling -> Axis, FillingStyle -> Green],
 PlotRange -> {0, 0.4}, AxesOrigin -> {0, 0.1},
 Ticks -> {Automatic, None}]
The plot range is set such that this code would not work in a generalized case for NormalDistribution[u,s].
What is the appropriate format for {x, xmin, xmax} in the Plot function above for the general case of a normal distribution with mean = u and standard deviation = s?


