Update
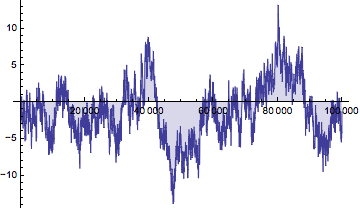
I would now like to produce a plot that explores the difference between the squarefree count and the expected mean (without using SquareFreeQ) - something along the lines of:
a = PrimeOmega[Range[1000]];
b = PrimeNu[Range[1000]];
ListLinePlot[{#/Zeta[2] - Accumulate[Flatten[Inner[If[#1 === #2, 1, 0]
&, a, b, List]]]}, Filling -> Axis]
or
a = PrimeOmega[Range[100]];
b = PrimeNu[Range[100]];
Plot[{x/Zeta[2] - Accumulate[Flatten[Inner[If[#1 === #2, 1, 0] &, a, b, List]]]},
{x, 0, 100}, Filling -> Axis]
In the hope of achieving something similar to:
Plot[{{x/Log[x]} - PrimePi[x]}, {x, 0, 100}, Filling -> Axis]
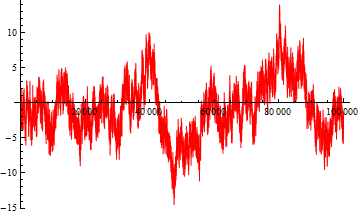
Or alternatively, slightly alter Artes' cf plot (see below).
Instead of:
cf = {#, Count[Range[#, # + 500], _?SquareFreeQ]} & /@ Range[0, 100000, 500]
Using something like:
a = PrimeOmega[Range[100000]];
b = PrimeNu[Range[100000]];
cf = {#, Count[Range[#, # + 500], _?Accumulate[Flatten[Inner[If[#1 === #2, 1, 0]
&, a, b, List]]]]} & /@ Range[0, 100000, 500]
... Much clumsier, I realise, but I would like to avoid using SquareFreeQ if I can.
Old
I would like mathematica to output instances where PrimeOmega[x]=PrimeNu[x] up to a given range. (Clearly in this example, the output will be the set of square free numbers.)
a = PrimeOmega[Range[1000000]];
b = PrimeNu[Range[1000000]];
Count[Transpose[{a, b}], {1, 1}]
a = PrimeOmega[Range[1000000]];
b = PrimeNu[Range[1000000]];
Count[Transpose[{a, b}], {2, 2}] .....
works, but is (a) very slow, and (b) very clumsy.
I was wondering if there was a more succinct way of putting it?
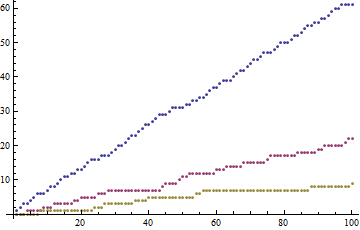
In addition, I would like to ultimately create a plot for what will essentially be a counting function for PrimeOmega[x]&&PrimeNu[x]=={1, 1},{2, 2}... etc. Is there any way of doing this?


