#Update#
Update
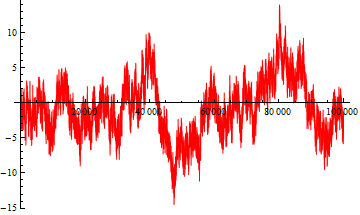
OK - First part of update solved:
a = PrimeOmega[Range[100000]];
b = PrimeNu[Range[100000]];
c = Range[100000];
ListLinePlot[{c/Zeta[2] - Accumulate[Flatten[Inner[If[#1 === #2, 1, 0]
&, a, b, List]]]}, PlotStyle -> Red]

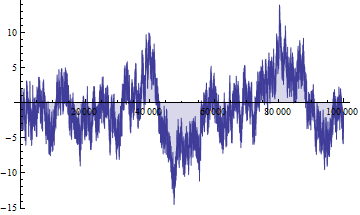
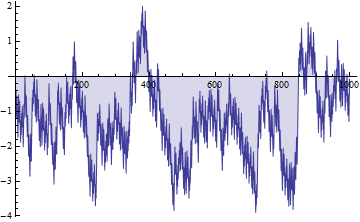
... Just unsure how to modify Artes' count plot.
#Old#
Old
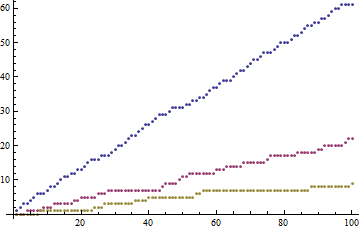
Sorry Artes, yes - was looking for this kind of thing:
a = PrimeOmega[Range[100]];
b = PrimeNu[Range[100]];
ListPlot[{Accumulate[Flatten[Inner[If[#1 === #2, 1, 0] &, a, b, List]]],
Accumulate[Flatten[Inner[If[#1 === #2 + 1, 1, 0] &, a, b, List]]],
Accumulate[Flatten[Inner[If[#1 === #2 + 2, 1, 0] &, a, b, List]]]}]


