2
$\begingroup$

Say I create a plot using Show and use the option PlotRange->All, for instance

surf[u_,v_]:={(1-u*Sin[v/2])*Cos[v], (1-u*Sin[v/2])*Sin[v],u*Cos[v/2]};
partdif1[u_,v_] := (D[surf[x,y],x] /. x -> u) /. y -> v;
partdif2[u_,v_] := (D[surf[x,y],y] /. x -> u) /. y -> v;
cpdiffs[u_,v_] := (Cross[partdif1[x, y], partdif2[x, y]] /. x -> u) /. y -> v;
NV[u_, v_] := -0.8*cpdiffs[u, v]/Norm[cpdiffs[u, v]];
surfplot = ParametricPlot3D[surf[u, v], {u, -1/4, 1/4}, {v, 0, 2*Pi}, PlotStyle -> "DeepSeaColors", Mesh -> False, Axes -> False, Boxed -> False];
nvect = Graphics3D[{Black, Thickness[0.004], Arrow[{surf[0, 0], surf[0, 0] + NV[0, 0]}]}];

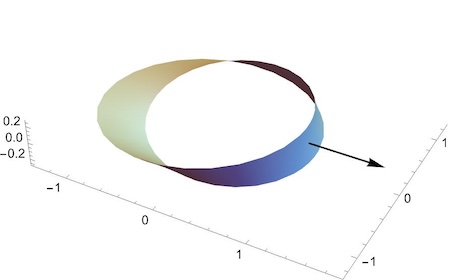
Show[surfplot, nvect, PlotRange -> All]

How can I extract the numerical values of the plot range? I want to use the values in a Wolframscript, so please no clicking solution.

$\endgroup$
1
  • 1
    $\begingroup$ AbsoluteOptions[surfplot, PlotRange] ? $\endgroup$
    – Syed
    Commented Feb 20 at 9:55

1 Answer 1

4
$\begingroup$
sh = Show[surfplot, nvect, PlotRange -> All];

pr = AbsoluteOptions[sh, PlotRange]

{PlotRange -> {{-1.25, 1.8}, {-1.17678, 1.17678}, {-0.25, 0.25}}}

To extract the values:

Values @ First @ pr

{{-1.25, 1.00764}, {-1.17678, 1.17678}, {-0.25, 0.25}}

Show[sh, Axes -> True]

enter image description here

$\endgroup$
2
  • $\begingroup$ That's great! Many thanks! Could you explicitetly give the command that gives the values only? $\endgroup$
    – 220284
    Commented Feb 20 at 10:08
  • $\begingroup$ Thanks for the accept. To get the values only: Values@First@AbsoluteOptions[sh, PlotRange] $\endgroup$
    – eldo
    Commented Feb 20 at 10:16

Your Answer

By clicking “Post Your Answer”, you agree to our terms of service and acknowledge you have read our privacy policy.

Not the answer you're looking for? Browse other questions tagged or ask your own question.