2
$\begingroup$

I want to find the number of real roots that satisfy this equation:

f[g[x]] - h[f[x]] == (a)^2

Where:

f[x_] = x*Cos[x]
g[x_] = CubeRoot[-5 + (x)^2]
h[x_] = Abs[x + 2]

Where x is given as between the values of 0 and 5 i.e. [0,5]. And a is a parameter that i can change the value of.

What I have tried so far is to animate the function to just get a visual on the functions. I wrote this code:

Animate[Plot[{f[g[x]] - h[f[x]], (a)^2}, {x, 0, 5}], {a, 0, 1}]

I then wondered what might be the maximum value in this interval and I found it to be 0.511 when x = 2.4987. I used this code:

FindMaximum[{f[g[x]] - h[f[x]]}, {x, 2, 5}]

That value is given when a = 0.71499.

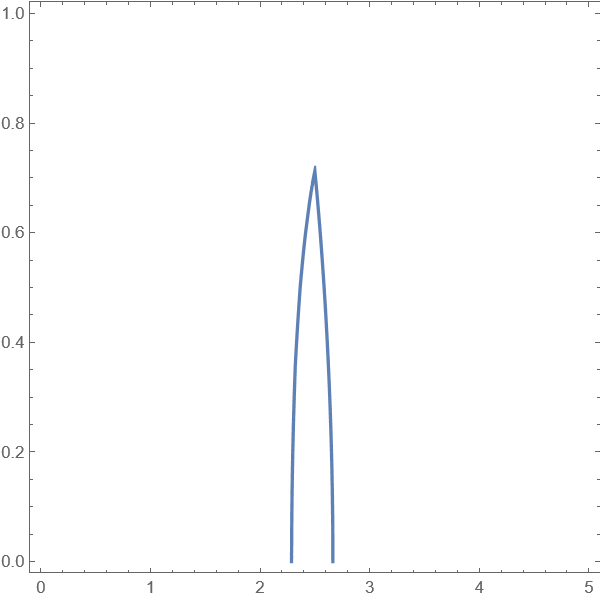
By a purely graphical analysis there are always two solutions to this equation at any one value of a when a is between the values of [0,0.71499). At a=0.71499 there is only one solution and beyond it there are no solutions. Now how do I calculate the total number of roots to this equations? I have tried the command CountRoots but it doesn't yield a result. Any other suggestions?

$\endgroup$
1
  • $\begingroup$ CountRoots expects a univariate function ! $\endgroup$ Commented Sep 13, 2023 at 15:29

3 Answers 3

3
$\begingroup$

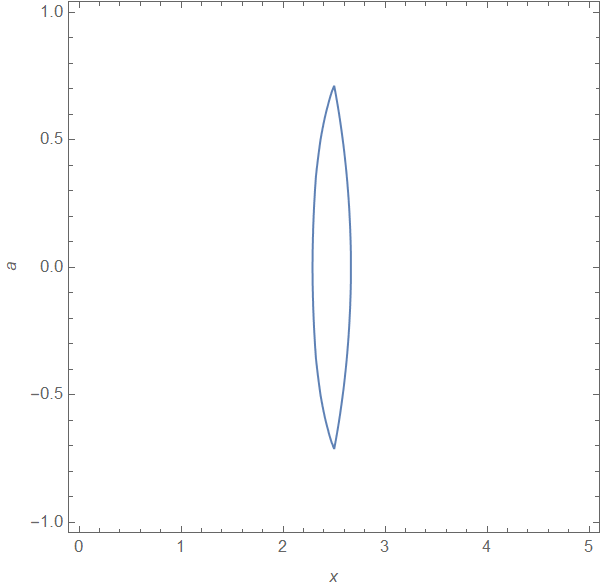
ContourPlot gives you an idea of the answer I think

f[x_] = x*Cos[x]
g[x_] = CubeRoot[-5 + (x)^2]
h[x_] = Abs[x + 2]

pic=ContourPlot[f[g[x]] - h[f[x]] == (a)^2, {x, 0, 5}, {a, -1, 1}, FrameLabel -> {x, a}]

enter image description here

The peak-values follow from

mini = NMinimize[{a, f[g[x]] - h[f[x]] == (a)^2, Element[a, Reals]}, {x, a}] 
(*{-0.715053, {x -> 2.49876, a -> -0.715053}}*)
maxi = NMaximize[{a, f[g[x]] - h[f[x]] == (a)^2,Element[a, Reals]}, {x, a}] 
(*{0.714933, {x -> 2.49863, a -> 0.714933}}*)

amin=a/.mini[[2]]; (*-0.715053*)
amax=a/.maxi[[2]]; (*0.714933*) 

As you can see from ContourPlot:

There exist two solutions if amin<a<amax There exists one solutions if a==amin or a==amax In all other cases there is no real solution

There exists no solution if `a>a/.maxi

$\endgroup$
4
  • $\begingroup$ It's clear the plot is symmetric with respect to a-axis since the function is even in a. $\endgroup$
    – user64494
    Commented Sep 13, 2023 at 15:17
  • $\begingroup$ I am sorry but I dont understand. What is a contour plot, how exactly does it answer my question and how do I calculate the number of real roots with this information? $\endgroup$ Commented Sep 13, 2023 at 15:27
  • $\begingroup$ @IhabAlrikabi In my answer ContourPlot[...] plots all points x,a which fullfill the equation f[g[x]] - h[f[x]] == (a)^2 $\endgroup$ Commented Sep 13, 2023 at 15:31
  • $\begingroup$ Oh ok I understand its purpose now but I dont see how I should use this info to calculate the number of solutions. $\endgroup$ Commented Sep 13, 2023 at 15:36
2
$\begingroup$

You can try FindInstance:

FindInstance[f[g[x]] - h[f[x]] == a^2, {a, x}, Reals]

And

FindInstance[f[g[x]] - h[f[x]] == a^2, {a, x}, Complexes]

Each of these yielded one solution, both outside your outside domain. Neither found multiple solutions, but that is limited by the methods available to the function.

$\endgroup$
0
$\begingroup$

Look at the result of

f[x_] = x*Cos[x];g[x_] = CubeRoot[-5 + (x)^2] ;h[x_] = Abs[x + 2];
ContourPlot[{f[g[x]] - h[f[x]] == (a)^2}, {x, 0, 5}, {a, 0, 1}]

enter image description here

to this end.

Addition.

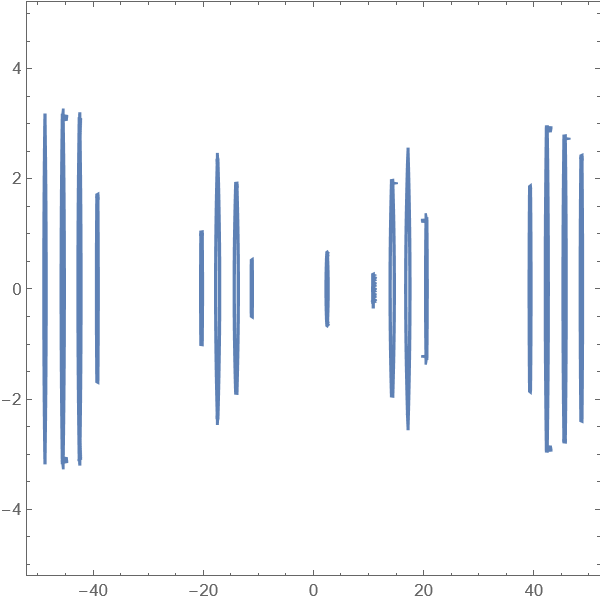
ContourPlot[{f[g[x]] - h[f[x]] == (a)^2}, {x, -50, 50}, {a, -5,5 },PlotPoints->100]

enter image description here

$\endgroup$

Your Answer

By clicking “Post Your Answer”, you agree to our terms of service and acknowledge you have read our privacy policy.

Not the answer you're looking for? Browse other questions tagged or ask your own question.