1
$\begingroup$

I have been trying to prepare a 2D histogram from a 2D-list; the dataset is:

data=RandomVariate[NormalDistribution[0, 1], {200, 2}];

if I do

HistogramList[data,100]

in order to use 100 bins in both dimensions. However, I have checked that Mathematica generates two arrays for 2D data of some larger number of bins for both dimensions, e.g. number of bins in the first dimension is 110 and in the second dimension, it is 92. I don't understand what is happening.

Is there a way to define the bin min,max,width in each dimension for HistogramList function for a 2d-data?

Any help would be much appreciated, thank you.

Also, one minor question I have regarding the output of a 2d histogram. What I have understood that the output is given for a dataset like:

 {{bx1,bx2,...},{by1,by2,...}}

output the order is like: frequency of $by1,by2,...$ for given $bx1$ constant followed by frequency of $by1,by2,...$ given $bx2$ and further and so on. In Mathematica help it is written in a form: $(bx(i),bx(i+1)] x [by(i),by(i+1))$

What does that exactly mean?

$\endgroup$

1 Answer 1

2
$\begingroup$

I will constrain my explanation to a 1D histogram only to keep the examples simple. This all applies to 2D too.

Explanation

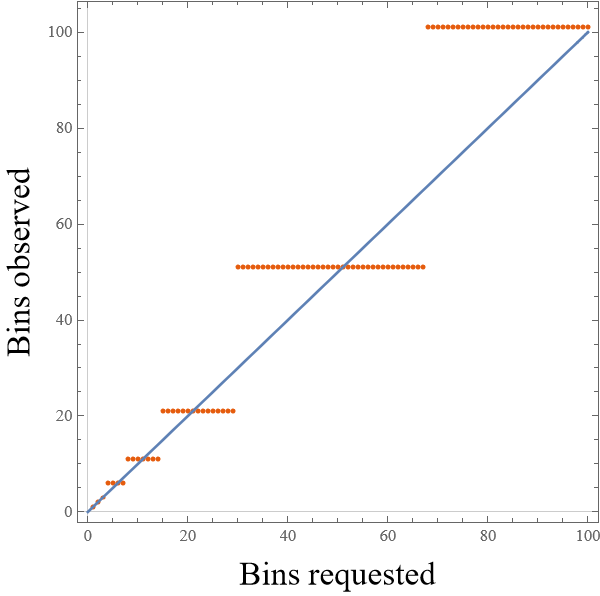
Clearly, the number of bins requested is not the same as the ones Mathematica returns with HistogramList, look here:

Show[
    ListPlot[
        Table[
            {
                k,
                Length@Last@HistogramList[Range[0,1,0.001],k]
            }
        ,{k,100}
        ]
    ,AspectRatio->1
    ,PlotTheme->"Scientific"
    ,FrameLabel->{
        Style["Bins requested",Black,20], 
        Style["Bins observed",Black,20]
        }
    ],
    Plot[x,{x,0,100}]
]

enter image description here

I see no indication in the documentation that this should be the case, however, the reason seems to be that Mathematica attempts to use "nice round numbers" for the bins (Probably using FindDivisions).

First@HistogramList[Range[0,1,0.001],11]

enter image description here

Notice that the bins are a list of the interval edges. Therefore each bin is defined as the interval between two values in the list, inclusive on the left ( a closed interval denoted by square bracket $[$ ) and non-inclusive on the right ( open interval denoted by round bracket $)$ ). That is what the documentation means with the bpsec definition:

{{b1,b2,…}} use bins [b1,b2),[b2,b3),…

enter image description here

Solution

Define the bins by hand. Mathematica will not try to use "nice numbers" if you give explicitly the bins

HistogramList[data,{Array[#&, 11 ,{-2.1,2.1}]}]

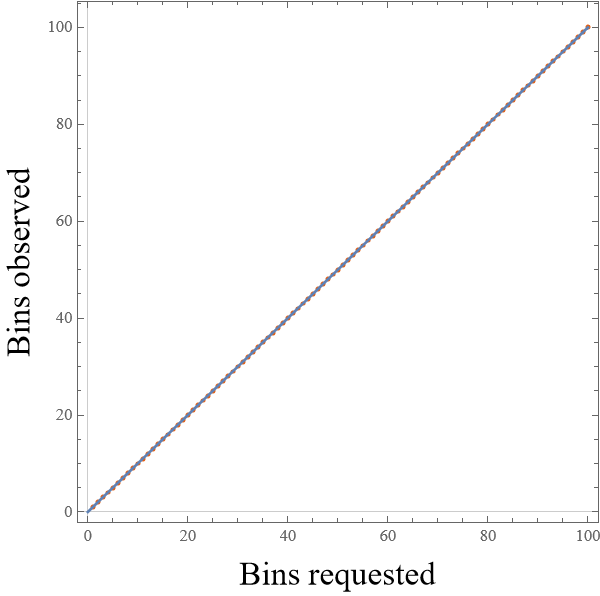
Here the observed number of bins, and what is asked are the same.

Show[
    ListPlot[
        Table[
            {
                k,
                Length@First@HistogramList[data,{Array[#&,k {-2.1,2.1}]}]
            }
        ,{k,100}
        ]
    ,AspectRatio->1
    ,PlotTheme->"Scientific"
    ,FrameLabel->{
        Style["Bins requested",Black,20], 
        Style["Bins observed",Black,20]
        }
    ],
    Plot[x,{x,0,100}]
]

enter image description here

$\endgroup$

Your Answer

By clicking “Post Your Answer”, you agree to our terms of service and acknowledge you have read our privacy policy.

Not the answer you're looking for? Browse other questions tagged or ask your own question.