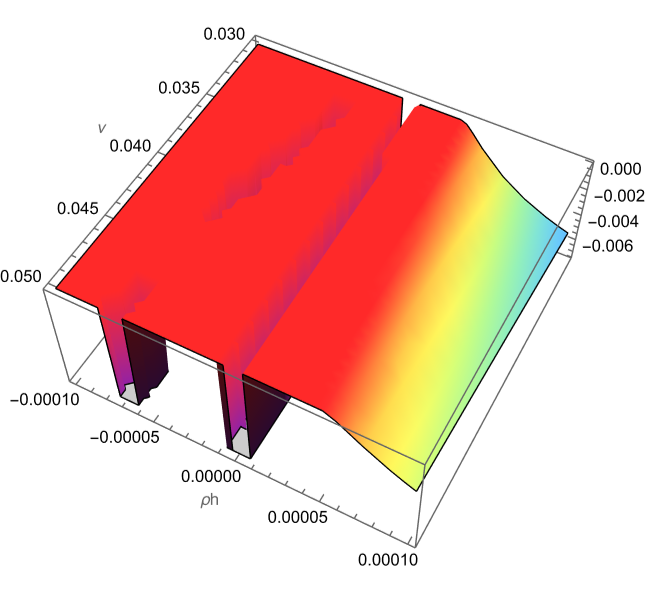
I want a function auxiliarfunction that depends on two variables: ρh and ν. I need to plot the implicit function defined as auxiliarfunction==0. However, this function is a bit messy and I haven't been able to plot it directly using CountourPlot. The good thing is that that function is defined as an intersection of various curves that are also defined implicitly so I am trying to use pseudo-arclength continuation using each of those conditions to simplify the problem. In particular, I have the following piece of code:
f1 = c*(S*A^2)/H - mu*A + ρa*Y;
f2 = c*S*A^2 - ν*H + ρh*Y;
f3 = c0 - γ*S - ϵ*Y*S;
f4 = d*A - e*Y + Y^2/(1 + f*Y^2);
eq = Solve[{f1 == 0, f2 == 0, f3 == 0, f4 == 0}, {A, H, S, Y}][[3]];
jacobianmat = D[{f1, f2, f3, f4}, {{A, H, S, Y}}];
diffmatrix = DiagonalMatrix[{D1, D2, D3, D4}];
det = Simplify[Det[jacobianmat - μ*diffmatrix]];
der = Simplify[D[det, μ]];
ksquared = Solve[der == 0, μ][[1]];
c = 0.002;
mu = 0.16;
ρa = 0.005;
c0 = 0.02;
γ = 0.02;
ϵ = 0.1;
d = 0.008;
e = 0.1;
f = 10.0;
D1 = 0.001;
D2 = 0.02;
D3 = 0.01;
D4 = 10^-7;
ksquared = ksquared /. eq;
auxiliarfunction = det /. ksquared /. eq;
initialν = ν /. Quiet@FindRoot[auxiliarfunction == 0 /. ρh -> 1.0011*10^-5, {ν, 0.04}];
initialμ = (ksquared /. ν -> initialν /. ρh -> 1.0011*10^-5)[[1]][[2]];
initialvar = eq /. ν -> initialν /. ρh -> 1.0011*10^-5;
detaux = det /. ν -> ν[t] /. ρh -> ρh[t] /. μ -> μ[t] /. A -> A[t] /. S -> S[t] /.
    Y -> Y[t] /. H -> H[t];
deraux = der /. ν -> ν[t] /. ρh -> ρh[t] /. μ -> μ[t] /. A -> A[t] /. S -> S[t] /.
    Y -> Y[t] /. H -> H[t];
f1aux = f1 /. ν -> ν[t] /. ρh -> ρh[t] /. μ -> μ[t] /. A -> A[t] /. S -> S[t] /.
    Y -> Y[t] /. H -> H[t];
f2aux = f2 /. ν -> ν[t] /. ρh -> ρh[t] /. μ -> μ[t] /. A -> A[t] /. S -> S[t] /.
    Y -> Y[t] /. H -> H[t];
f3aux = f3 /. ν -> ν[t] /. ρh -> ρh[t] /. μ -> μ[t] /. A -> A[t] /. S -> S[t] /.
    Y -> Y[t] /. H -> H[t];
f4aux = f4 /. ν -> ν[t] /. ρh -> ρh[t] /. μ -> μ[t] /. A -> A[t] /. S -> S[t] /.
    Y -> Y[t] /. H -> H[t];
detaux = D[detaux, t];
deraux = D[deraux, t];
f1aux = D[f1aux, t];
f2aux = D[f2aux, t];
f3aux = D[f3aux, t];
f4aux = D[f4aux, t];
sol = NDSolve[{detaux == 0, deraux == 0, f1aux == 0, f2aux == 0, f3aux == 0, f4aux == 0,
    ν'[t]^2 + ρh'[t]^2 + μ'[t]^2 + A'[t]^2 + H'[t]^2 + S'[t]^2 + Y'[t]^2 == 1,
    ρh[0] == 1.0011*10^-5, ν[0] == initialν, μ[0] == initialμ,
    A[0] == initialvar[[1]][[2]], H[0] == initialvar[[2]][[2]],
    S[0] == initialvar[[3]][[2]], Y[0] == initialvar[[4]][[2]]},
    {ν[t], ρh[t], μ[t], A[t], H[t], S[t], Y[t]}, {t, -100, 100},
   Method -> "StiffnessSwitching"];
It is relevant to notice here that some of the initial conditions are complex. For that reason, I am deriving each of the functions of the system with respect to t. The problem is that still Mathematica recognizes the system as a DAE and I don't know why. After running the code shown above, I get the following warning:
The problem is that if I change the method following the instruction of the warning, I get a second warning:
The question is: what should I do to overcome the problems with the warnings? Is there a way to use the suggested method but integrate the system with a Non-IDA method? I have tried this approach with other systems of equations and it works well, but I don't know what to do in this case.


f1,f2,f3andf4are only the kinetics. I want to plot a Turing bifurcation curve. I know that the third equilibrium of the system goes through this bifurcation when we take the parameter values provided. The conditions for this bifurcation are essentially two: 1.-The determinant of the jacobian matrix of the system including diffusion is equal to zero and 2.-The derivative of the zero-eigenvalue of the system including diffusion is equal to zero. $\endgroup$det==0andder==0. In this case,jacobianmat - μ*diffmatrixis the jacobian matrix of the system including diffusion. As you can see, the functionauxiliarfunctiontakes into account everything I have said. It has the equilibrium point evaluated, and a solution to the equationder==0, that has to do with the derivative of the zero-eigenvalue. The problem is that that function is a mess and I haven't been able to get an implicit plot out of it. Instead, I am trying to parametrize the curve. $\endgroup$Solvefailed to solve for the derivatives. IfNDSolvecannot get the system into the explicit form $x’(t) = f(t, x(t))$, then it has to use an implicit integrator, and I think IDA is the only method available. If you can solve for the derivatives and put the ODE in the form $x’(t)=f(t,x(t))$, then it should make non-IDA methods available. $\endgroup$