17
$\begingroup$

What I'm actually trying to do is to elaborate this question. I'd like to use Pane with scrollbars enabled to explore large (sparse) matrices like this one:
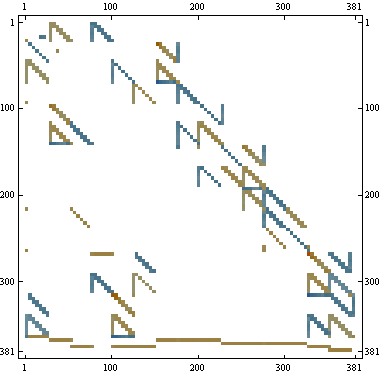
enter image description here

Here is what I have so far using some ideas from this answer:

A = ExampleData[{"Matrix", "HB/west0381"}, "Matrix"] // Normal;
{n, m} = Dimensions@A;
mp = MatrixPlot[A, ImageSize -> 9 m, Mesh -> All];
DynamicModule[{trans, ij, mpos},
 trans[{x_, y_}] := {Clip[Floor[n - y] + 1, {1, n}],
   Clip[Floor@x + 1, {1, m}]};
 Pane[
  Show[mp, ImagePadding -> {{40, 20}, {20, 20}},
   Epilog -> Text[
      Framed[
       Dynamic[(ij = trans@MousePosition["Graphics", {0, 0}]) -> 
         A[[Sequence @@ ij]]], Background -> White],
      Dynamic[MousePosition["Graphics", {0, 0}]],
      {1, -1}
      ]~Style~Larger
   ],
  {500, 500},
  Scrollbars -> True]
 ]

The result is
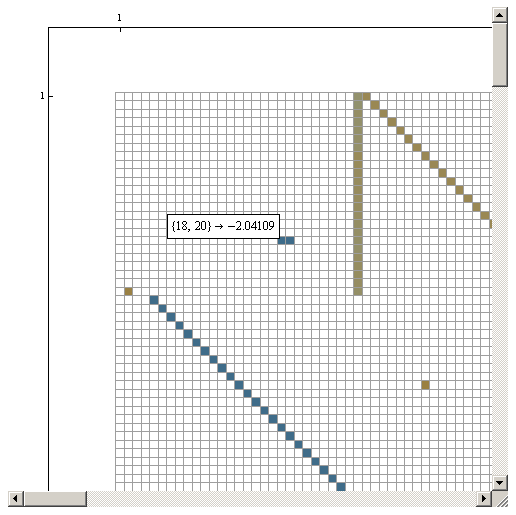
enter image description here


Now about the problems

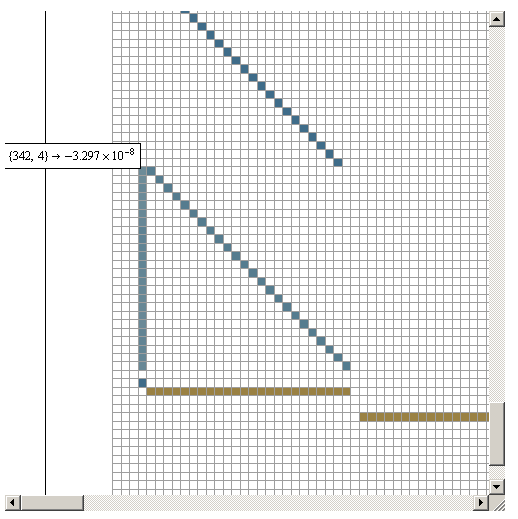
1. The main trouble is that it does not correctly translate coordinates for horizontal scrolling. If we don't touch the horizontal scrollbar everything is fine:
enter image description here

But if I slide horizontally the label shifts and falls outside the visible area. It looks like a Mma bug.

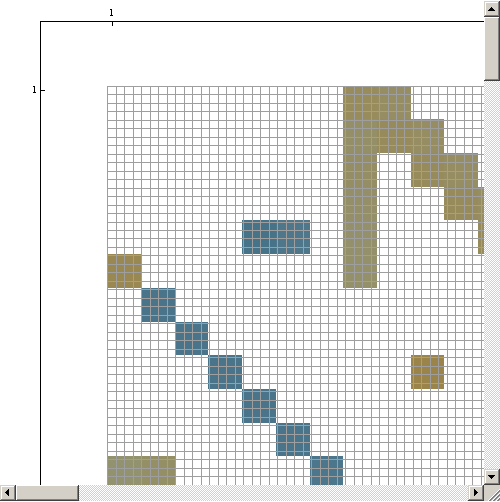
2. The second funny thing is that if I remove //Normal from the first row then MatrixPlot produces the following:
enter image description here

which seems to be the second bug.

3. And finally the issue which is due to my confusion with Dynamic things. In the code I use MousePosition["Graphics", {0, 0}] twice (can this be the reason for the item 1 from above?). When I tried to save this coordinates in a variable I had no luck. But there must be a way to do this.


SUMMARY

Thanks to Andy for resolving problems number 2 and 3, and to David for nice solution using MouseAnnotation. I accept kguler's answer since it resolves the main problem with runaway tooltip by effectively using CoordinatesToolOptions option. Here is complete working example with kguler's solution. Try it (to enable the tooltip right-click on the plot and select "Get Coordinates"):

mtrxPlot2[mat_, opts : OptionsPattern[]] := 
 With[{dims = Dimensions[mat],
   indx = {Clip[Floor[#1[[1]] - #2[[2]]] + 1, {1, #1[[1]]}], 
      Clip[Floor[#2[[1]]] + 1, {1, #1[[2]]}]} &}, 
  With[{copiedvalues = 
     "CopiedValueFunction" -> 
      Function[pt, {indx[dims, pt], Extract[mat, indx[dims, pt]]}], 
    coordtooltips = 
     "DisplayFunction" -> 
      Function[pt, 
       Row[{"mat[[", Row[indx[dims, pt], ","], "]]  =  ", 
         Extract[mat, indx[dims, pt]]},
        Background -> White,
        ImageSize -> {Automatic, 30},
        ImageMargins -> {{5, 5}, {10, 10}},
        Alignment -> Center]]},
   MatrixPlot[mat, opts, 
    CoordinatesToolOptions -> {coordtooltips, copiedvalues}]
   ]
  ]

A = ExampleData[{"Matrix", "HB/west0381"}, "Matrix"];
Pane[mtrxPlot2[A, ImageSize -> 3000, Mesh -> All, 
  MaxPlotPoints -> 500], {500, 500}, Scrollbars -> True]
$\endgroup$

3 Answers 3

5
$\begingroup$

Using mtrxPlot2 from my answer to the cited question inside Pane

   Pane[mtrxPlot2[A, ImageSize -> 9 m, Mesh -> All], {500, 500}, 
   Scrollbars -> True]

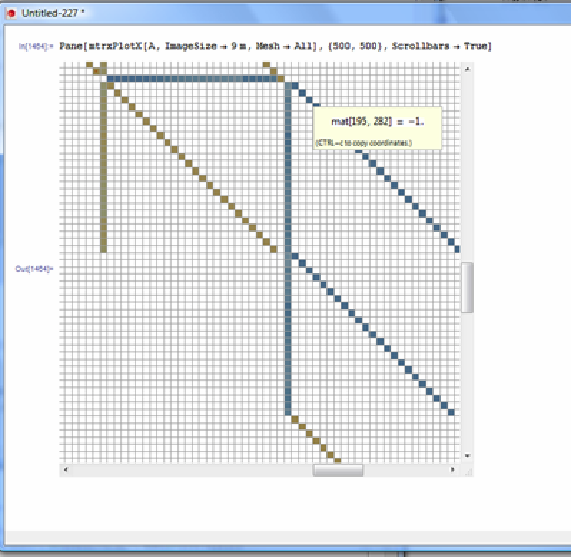
one cane exploit the built-in tooltip and copy features of the Get Coordinates Tool (clicking on the graph and hitting "." or using the context menu).

mtrxPlot2[mat_, opts : OptionsPattern[]] := 
With[{dims = Dimensions[mat], 
indx = {Clip[Floor[#1[[1]] - #2[[2]]] + 1, {1, #1[[1]]}], 
Clip[Floor[#2[[1]]] + 1, {1, #1[[2]]}]} &}, 
With[{copiedvalues = "CopiedValueFunction" -> Function[pt,
{indx[dims, pt], Extract[mat, indx[dims, pt]]}], 
coordtooltips = "DisplayFunction" -> Function[pt,
Row[{"mat[[", Row[indx[dims, pt], ","], "]]  =  ", 
Extract[mat, indx[dims, pt]]},
 Background -> White, ImageSize -> {Automatic, 30}, 
 ImageMargins -> {{5, 5}, {10, 10}}, Alignment -> Center]]}, 
MatrixPlot[mat, opts, 
CoordinatesToolOptions -> {coordtooltips, copiedvalues}]]]

Screenshot:

matrix plot in pane with tooltips

$\endgroup$
2
  • $\begingroup$ A wonderful solution. Could you paste the full working code here for convenience? $\endgroup$
    – faleichik
    Commented Mar 4, 2012 at 17:20
  • $\begingroup$ @faleichik, thank you very much. I added the copy of the code. $\endgroup$
    – kglr
    Commented Mar 5, 2012 at 4:58
7
$\begingroup$

MouseAnnotation

You could use MouseAnnotation to display the results under the pane. It is immune to the bugs you mention and has less overhead than a tooltip.

A = ExampleData[{"Matrix", "HB/west0381"}, "Matrix"] // Normal;
{n, m} = Dimensions@A;
trans[{x_, y_}] := {Clip[Floor[n - y] + 1, {1, n}], Clip[Floor@x + 1, {1, m}]};

Pane[MatrixPlot[A, ImageSize -> 9 m, Mesh -> All], {500, 500}, 
     Scrollbars -> True]

Dynamic@MouseAnnotation[(ij = 
 trans@MousePosition["Graphics", {0, 0}]) -> A[[Sequence @@ ij]]]

I removed Show, ImagePadding and Epilog from the original code (including one instance of MousePosition--the one used to position the Text).


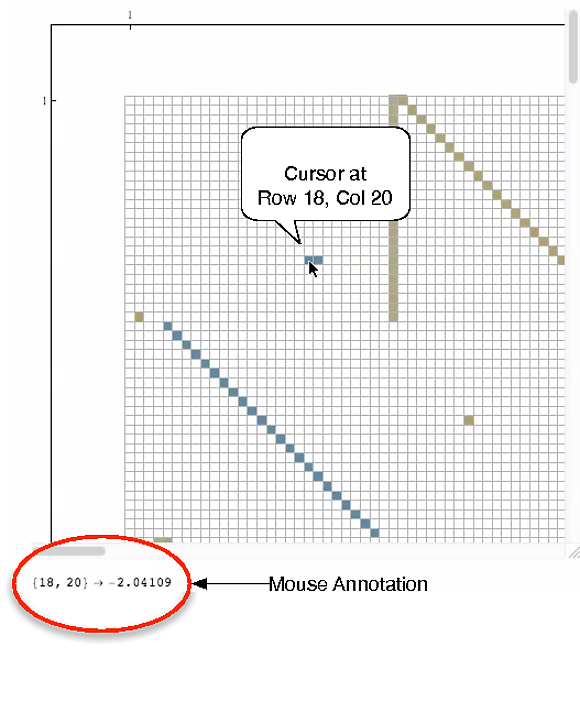
Edit The picture below shows the cursor at Row 18, Col 20. The mouse annotation, at the bottom left of the pic, shows that that Row 18, Col 20 of A has the value, -2.04109. The position, (row 18, col 20) corresponds to the coordinate (20, 18), not (18, 20).

cursor at row 18 col 20

Now let's ask A to confirm the value for that entry:

A[[18, 20]]

(* Out *) -2.04109

This works is the same manner for all columns, including those that have to be reached via the horizontal scrollbar.

$\endgroup$
3
  • $\begingroup$ This does not solve the problem of coordinates translation though. Anyway a big +1 for MouseAnnotation. $\endgroup$
    – faleichik
    Commented Mar 3, 2012 at 6:39
  • $\begingroup$ @faleichik Strange. It solves the coordinates translation problem on my machine. (Mac OSX 10.7.7, mms 8.0.4). And I was having the problems before the fix. $\endgroup$
    – DavidC
    Commented Mar 3, 2012 at 11:51
  • $\begingroup$ David, forgive me for the confusing formulation. By "coordinates translation problem" I meant incorrect position of tooltips after horizontal scrolling. $\endgroup$
    – faleichik
    Commented Mar 4, 2012 at 17:15
6
$\begingroup$

The solution to the second problem is easy. You can increase MaxPlotPoints to something larger (or just set it to Infinity). Seems that the method for choosing them automatically doesn't do so well with a large SparseArray.

Edit:

Part 3 can be accomplished by re-writing your Epilog as such..

Epilog -> 
  Dynamic[ij = MousePosition["Graphics", {0, 0}]; 
   Text[Framed[(trans@ij) -> A[[Sequence @@ (trans@ij)]], 
      Background -> White], ij, {1, -1}]~Style~Larger]]
$\endgroup$
4
  • $\begingroup$ Andy, what was the OP doing incorrectly in his Epilog that your edit fixes? $\endgroup$
    – rcollyer
    Commented Mar 2, 2012 at 19:38
  • $\begingroup$ @rcollyer they weren't doing anything incorrectly but they requested a solution that only used MousePosition a single time. $\endgroup$
    – Andy Ross
    Commented Mar 2, 2012 at 19:49
  • $\begingroup$ Sorry, I misread his question. $\endgroup$
    – rcollyer
    Commented Mar 3, 2012 at 4:50
  • $\begingroup$ Thank you, Andy. I didn'n expect that the second issue can be resolved that easy. This solution is somehow hard to guess. Looking to your solution of the part 3 I feel ashamed :-) $\endgroup$
    – faleichik
    Commented Mar 3, 2012 at 6:37

Your Answer

By clicking “Post Your Answer”, you agree to our terms of service and acknowledge you have read our privacy policy.

Not the answer you're looking for? Browse other questions tagged or ask your own question.