0
$\begingroup$

I have a function like $$f(x,y,z)=4 \sinh (2 y) \cosh (z-x)+5 \sin (2 x-y)-6 x+y+3 \cosh (2 z)$$ where $$0<x<4\;,\qquad-3<y<0\;,\qquad0<z<2$$

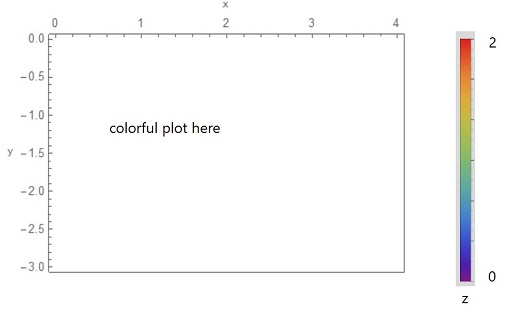
I would like to have a plot of this function for the two variables $x,y$ as a 2D plot, and the third variable $z$ changes with color ( ColorFunction for example from Blue to Red) with the step $0.01$, something like this

enter image description here

Is it possible to do this?

The function

f[x_, y_, z_] :=  5 Sin[2 x - y] + 3 Cosh[2 z] - 6 x + 4 Sinh[2 y] Cosh[z - x] + y
$\endgroup$
5
  • $\begingroup$ For every point {x,y} you intend to plot the two quantities z and(!) f[x,y,z]? How should that work? $\endgroup$ Commented May 25, 2021 at 15:42
  • $\begingroup$ I think we need more information about how you expect x, y, z, and f to be represented in the plot. $\endgroup$ Commented May 25, 2021 at 15:47
  • $\begingroup$ @UlrichNeumann You are right, my question is wrong. $\endgroup$
    – user80187
    Commented May 25, 2021 at 21:29
  • $\begingroup$ @UlrichNeumann I meant instead of a function, an equation; I have asked a new question here $\endgroup$
    – user80187
    Commented May 25, 2021 at 22:32
  • $\begingroup$ @BrettChampion I meant instead of a function, an equation; I have asked a new question here $\endgroup$
    – user80187
    Commented May 25, 2021 at 22:32

1 Answer 1

2
$\begingroup$

You have four dimensions {x, y, z, f}

$Version

(* "12.3.0 for Mac OS X x86 (64-bit) (May 10, 2021)" *)

Clear["Global`*"]

f[x_, y_, z_] := 
 5 Sin[2 x - y] + 3 Cosh[2 z] - 6 x + 4 Sinh[2 y] Cosh[z - x] + y
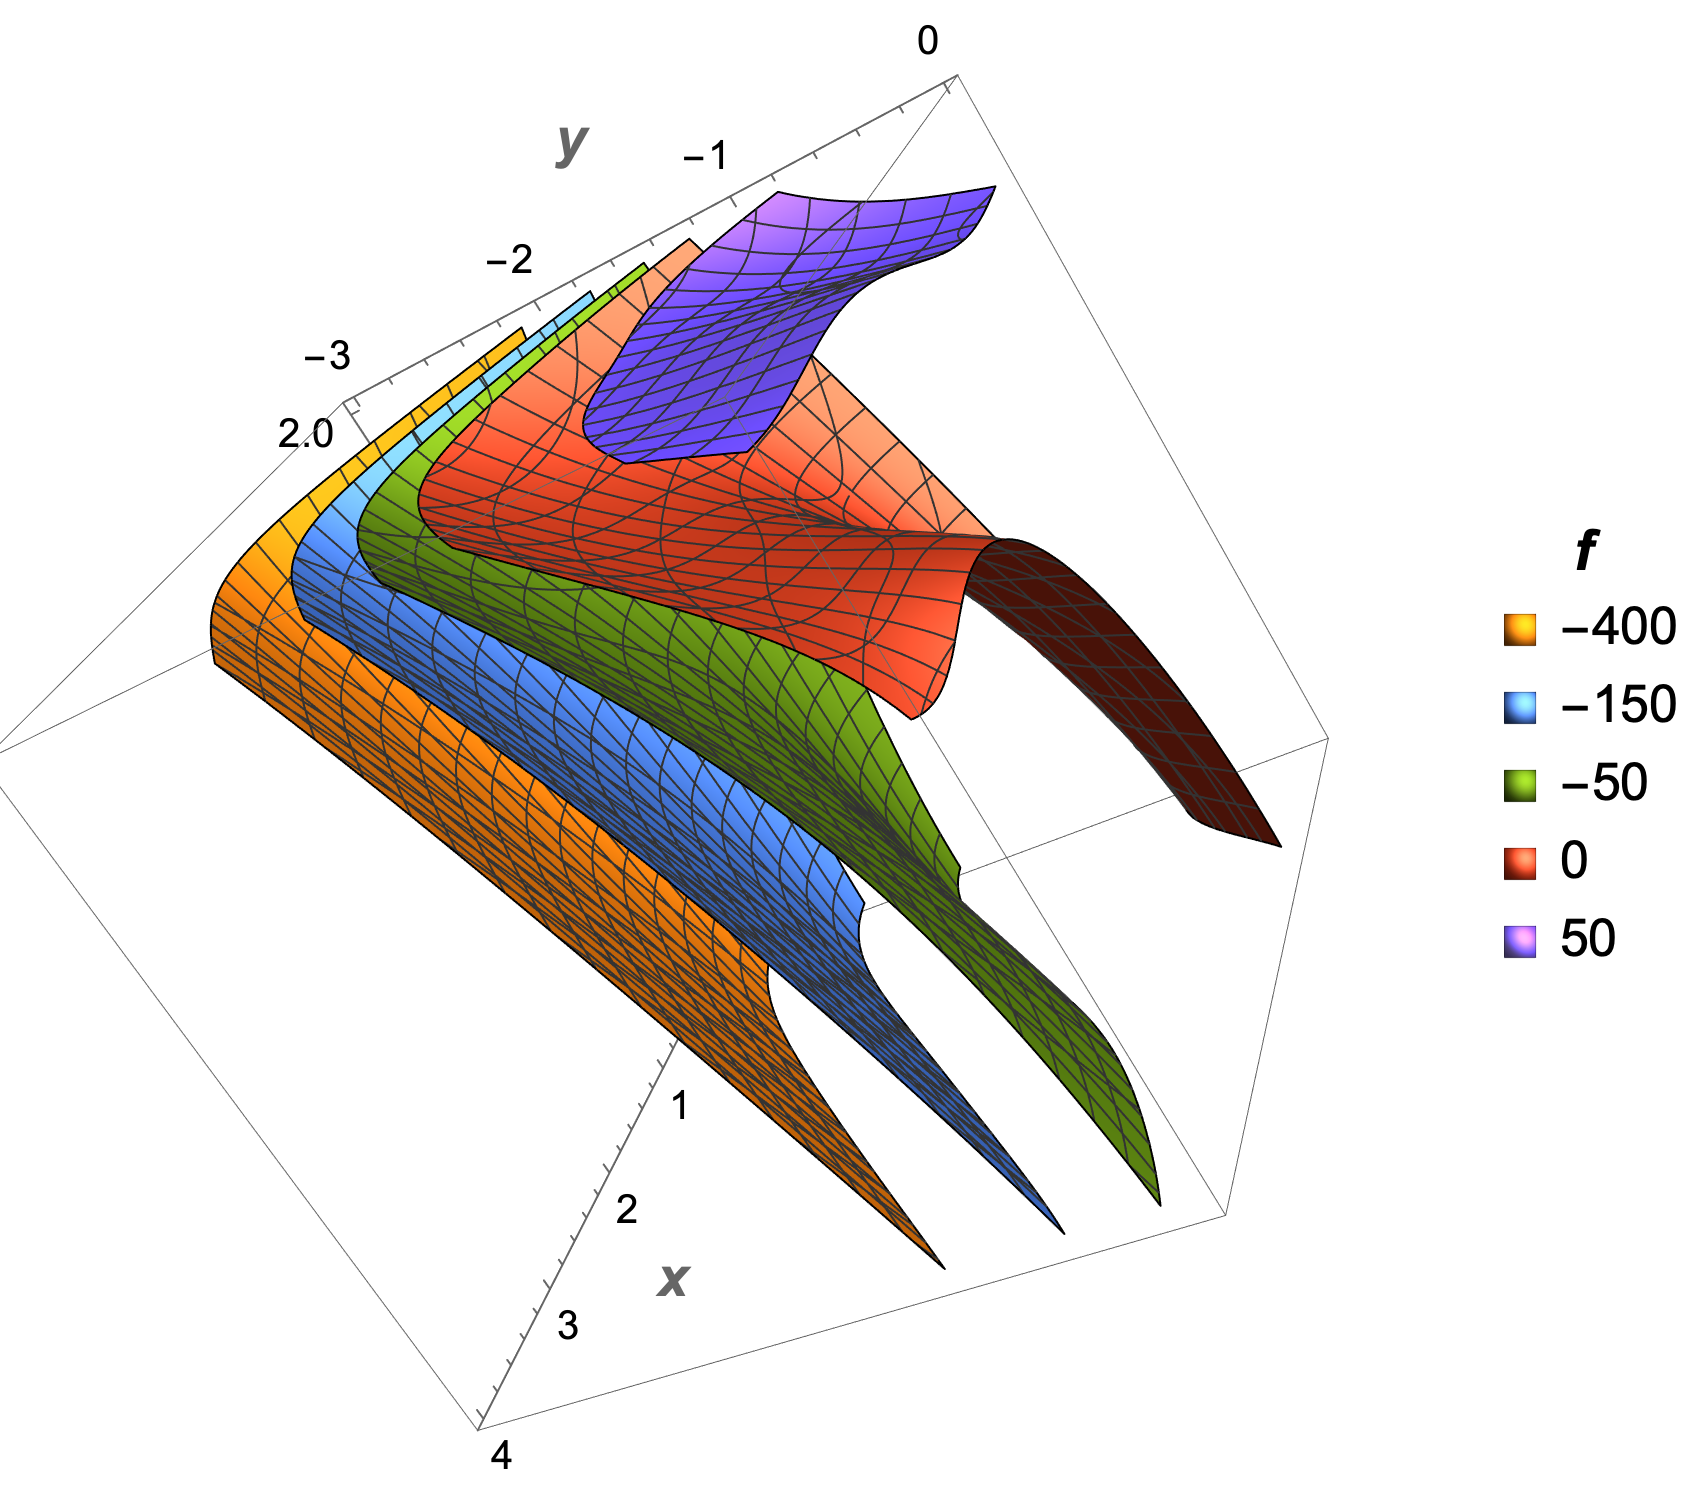
ContourPlot3D[f[x, y, z],
 {x, 0, 4}, {y, -3, 0}, {z, 0, 2},
 Contours -> {50, 0, -50, -150, -400},
 PlotLegends -> SwatchLegend[Automatic,
   LegendLabel -> Style[f, 14, Bold]],
 AxesLabel -> (Style[#, 14, Bold] & /@ {x, y, z})]

enter image description here

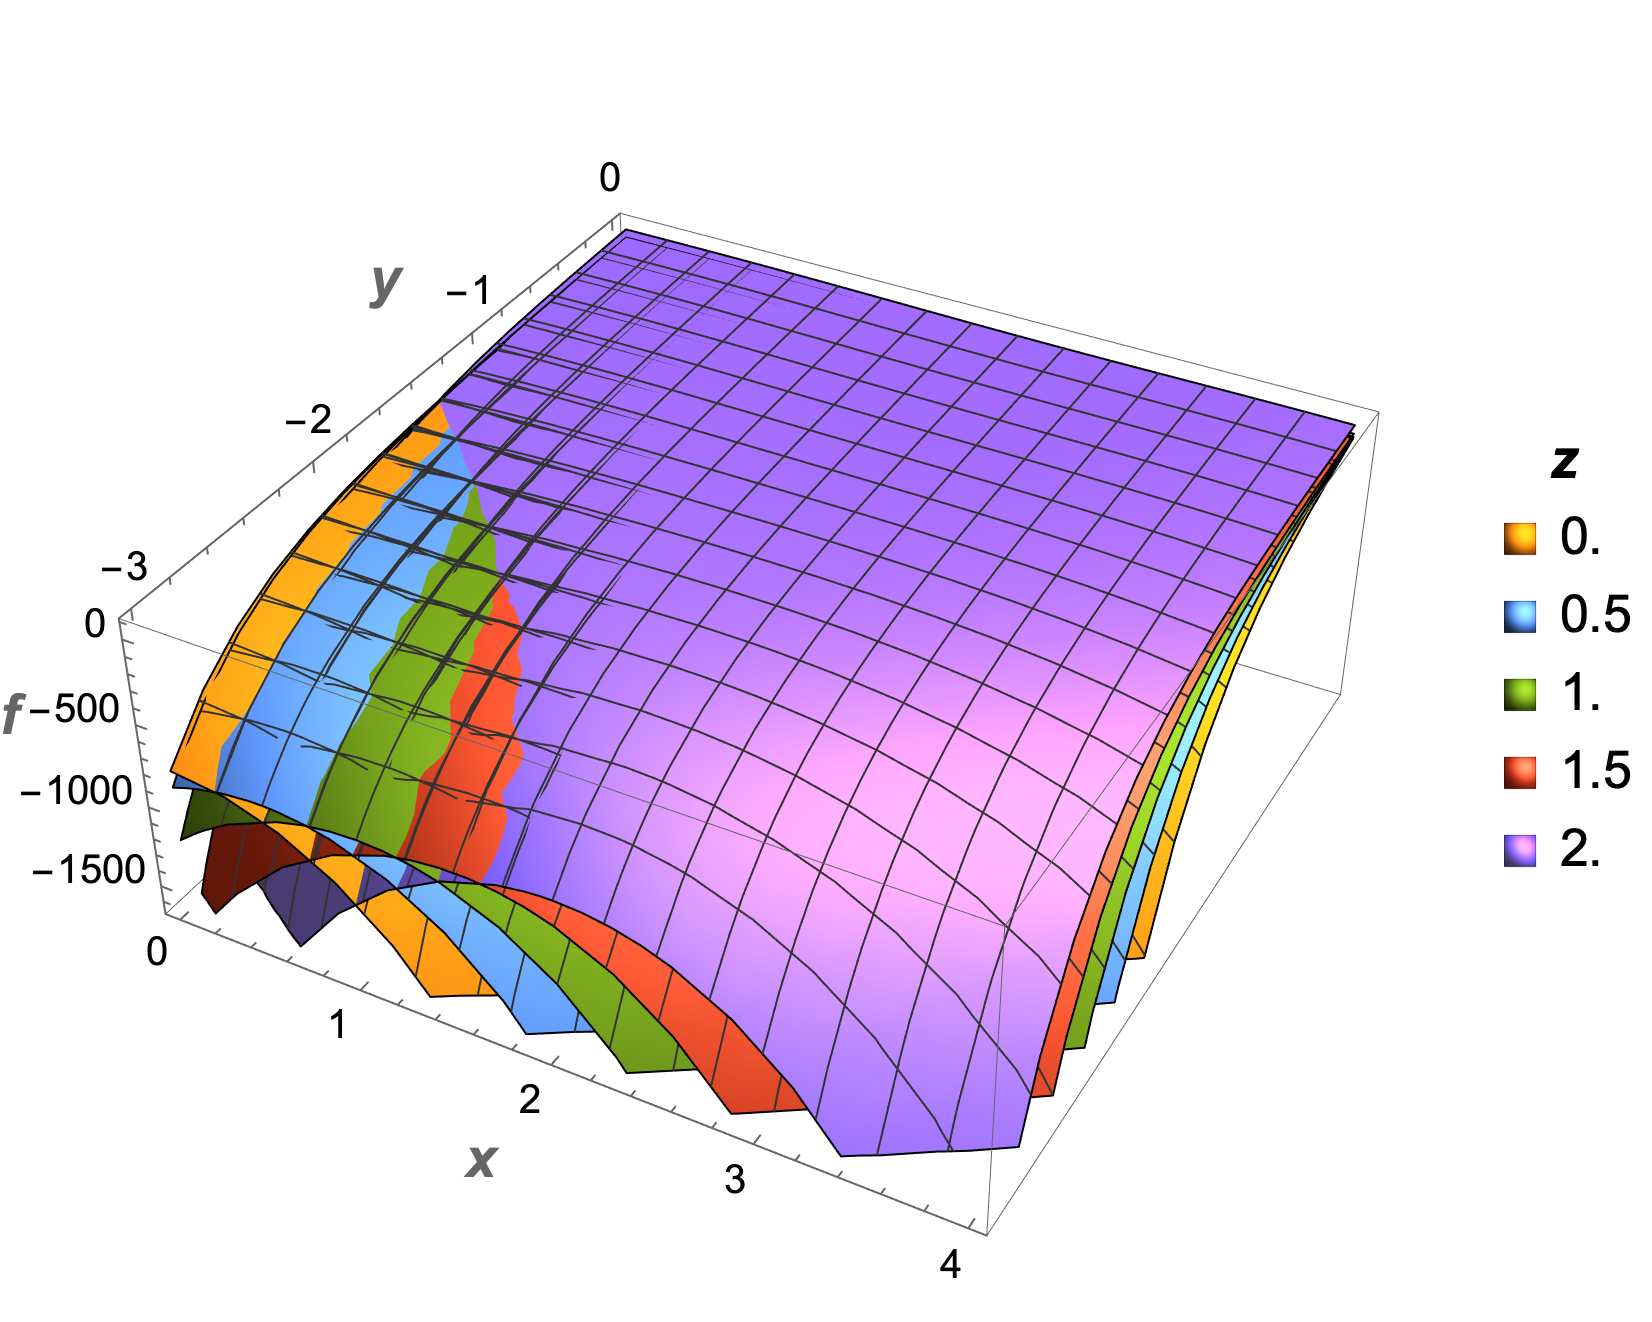
Plot3D[Evaluate@
  Table[f[x, y, z], {z, 0, 2, 0.5}],
 {x, 0, 4}, {y, -3, 0},
 PlotLegends -> SwatchLegend[Range[0, 2, 0.5],
   LegendLabel -> Style[z, 14, Bold]],
 AxesLabel -> (Style[#, 14, Bold] & /@ {x, y, f}),
 ClippingStyle -> None]

enter image description here

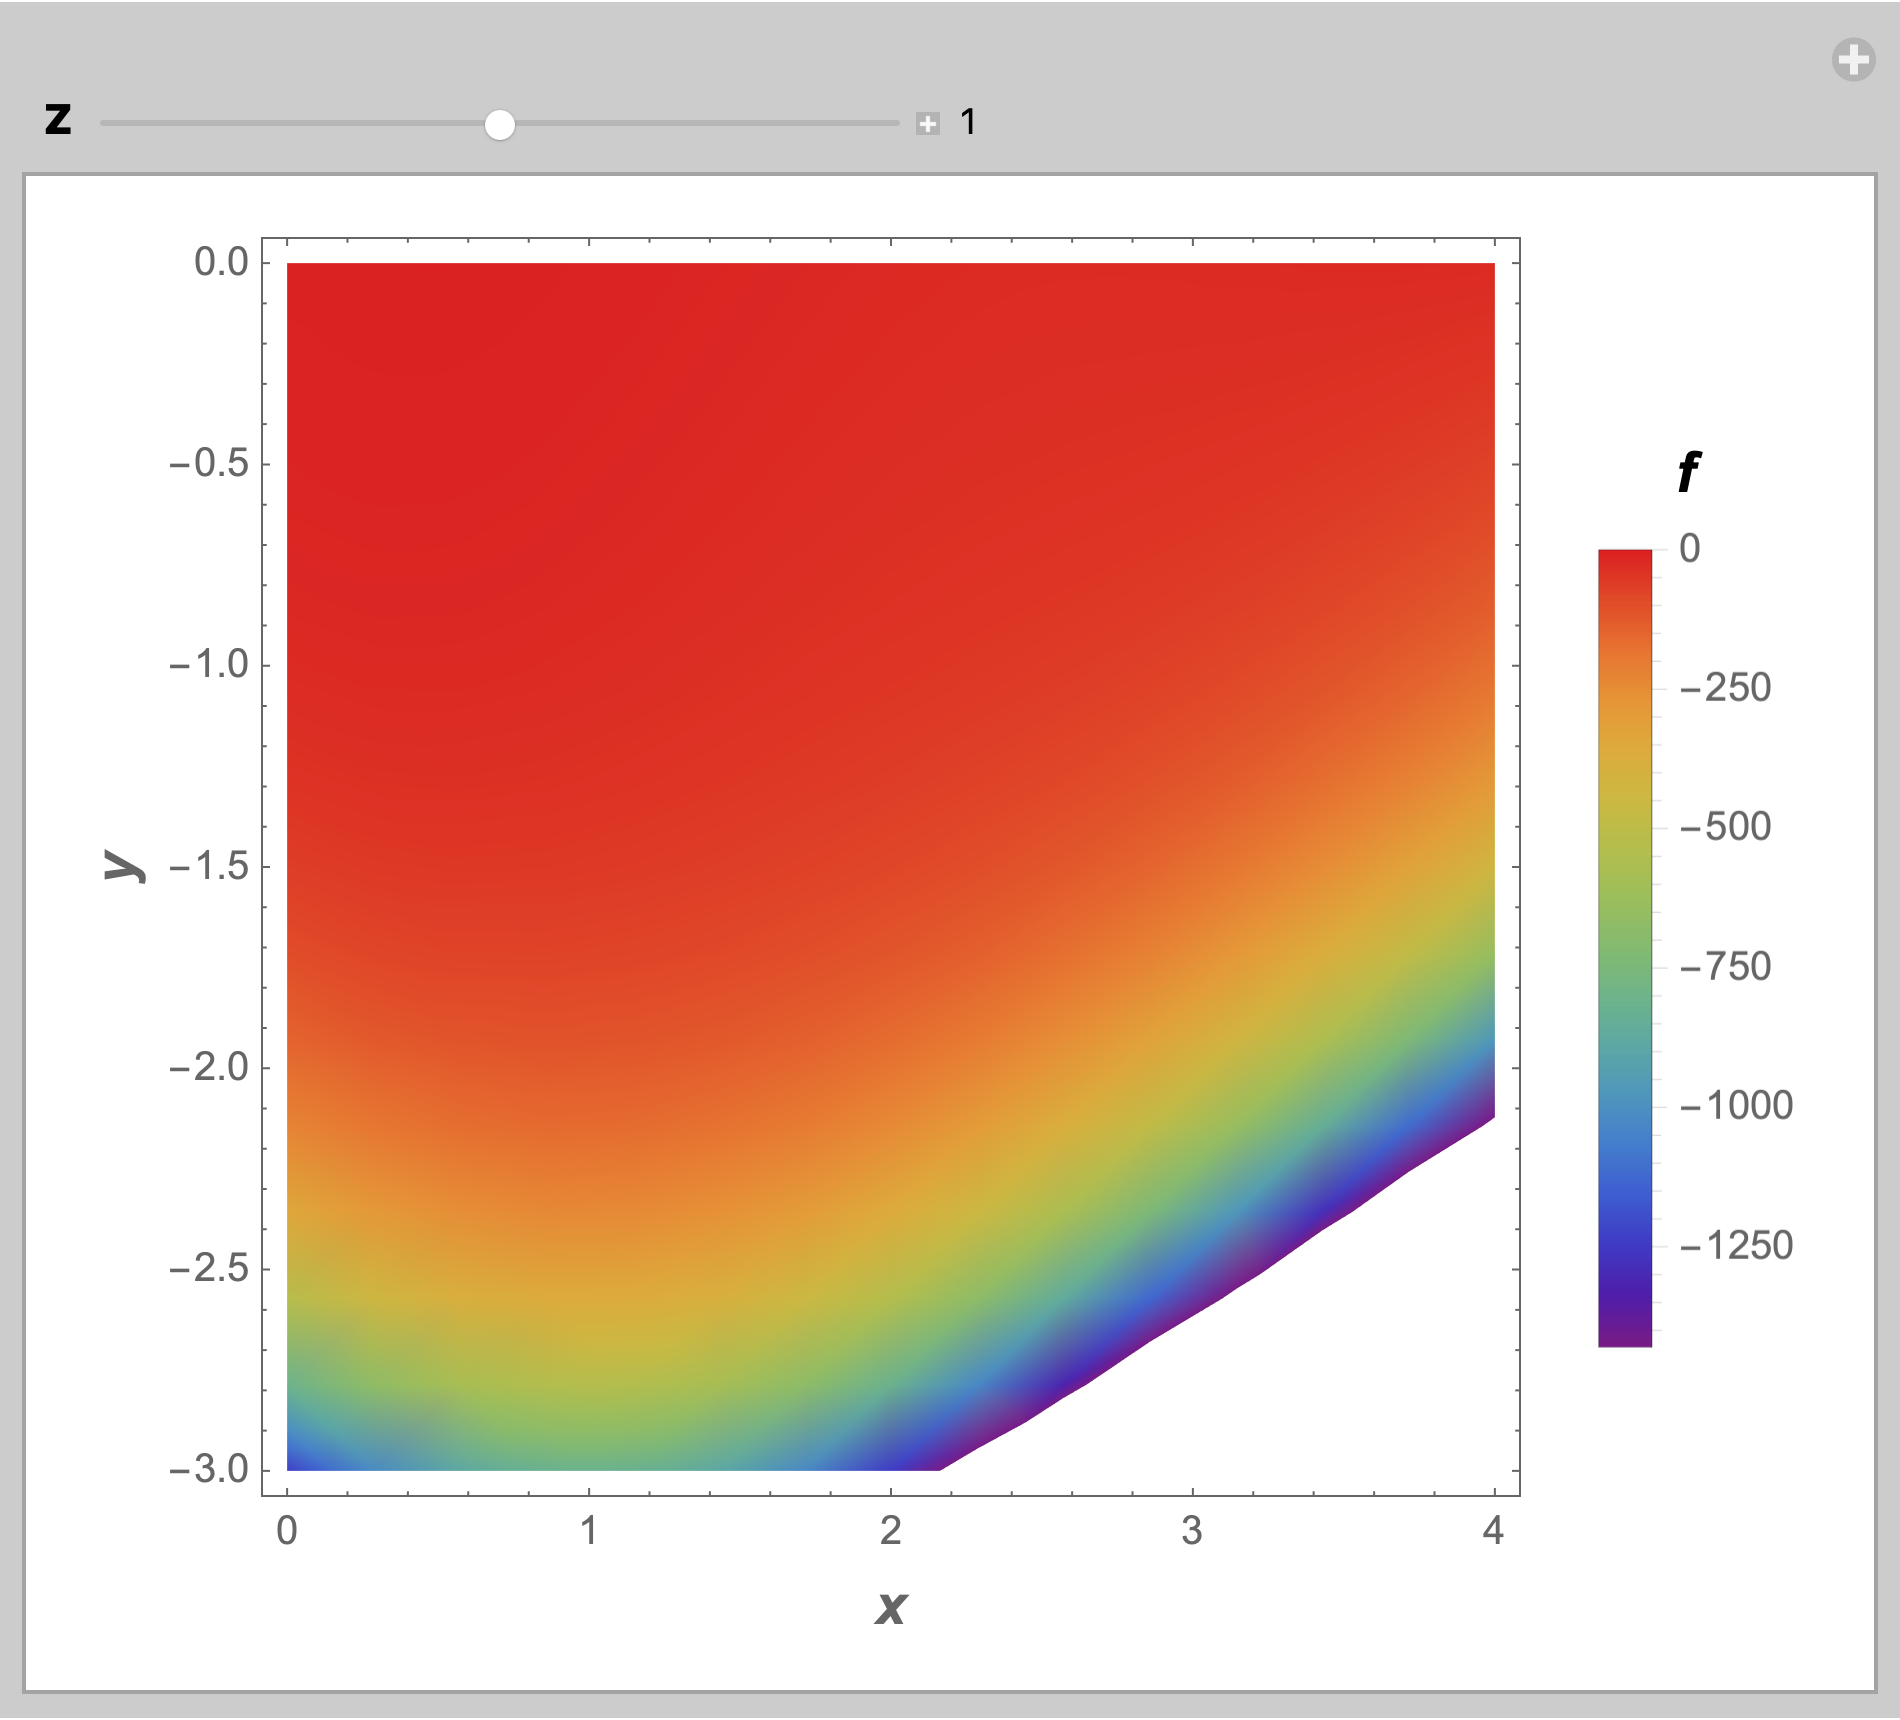
Manipulate[
 DensityPlot[f[x, y, z], {x, 0, 4}, {y, -3, 0},
  PlotLegends -> BarLegend[Automatic,
    LegendLabel -> Style[f, 14, Bold]],
  ColorFunction -> "Rainbow",
  FrameLabel -> (Style[#, 14, Bold] & /@ {x, y})],
 {{z, 1, Style["z", 14, Bold]}, 0, 2, 0.1,
  Appearance -> "Labeled"}]

enter image description here

$\endgroup$
1
  • $\begingroup$ Thank you, even though now I know that my question was wrong. $\endgroup$
    – user80187
    Commented May 25, 2021 at 21:30

Your Answer

By clicking “Post Your Answer”, you agree to our terms of service and acknowledge you have read our privacy policy.