I am trying to populate the rows and columns of a table by using a rule replacment.
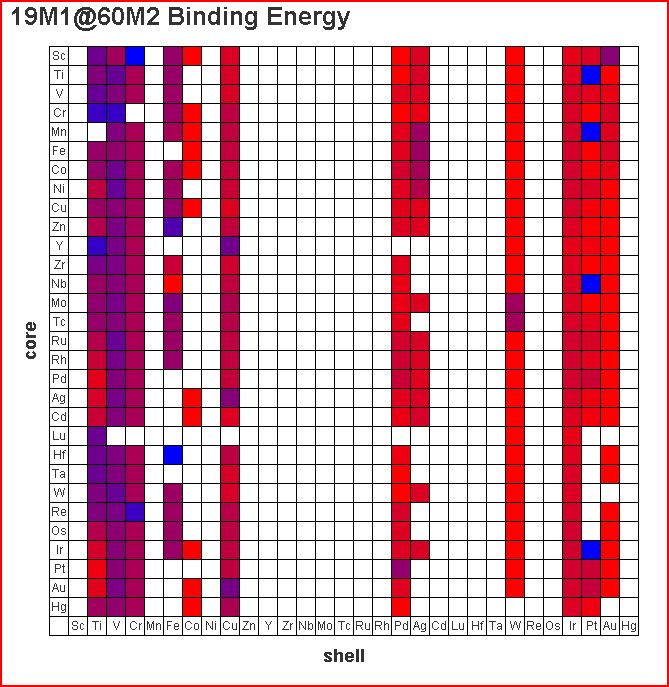
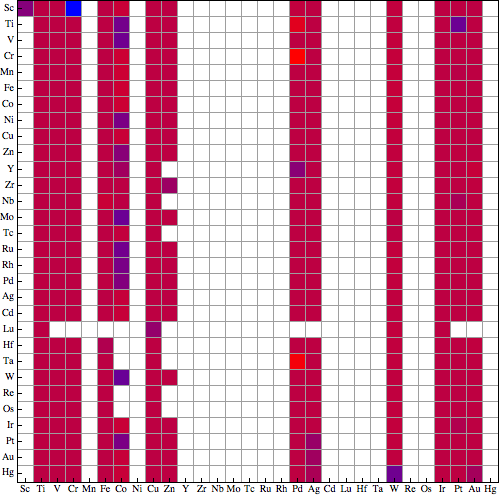
To generate a table that looks like this

For example Sc would be row 1, column 1.
An example of a record looks like this
 rawData = Import["H:\\allresults.json"]


record = {19, 60, "Ag", "Ag", "19Ag@60Ag_npo: -186.503305 by solar<br> \
19Ag@60Ag_bnp: -180.812004 by solar<br> O_sng:-8.032213 by \
marco<br>", "-1.675194475", "Binding Energy", "solar"}
Then I extract the relevant entries with some functions (there is probably a more elegant way to to do this)
getRow[resultVector_] := resultVector[[3]];
getColumn[resultVector_] := resultVector[[4]];
getResult[resultVector_] := resultVector[[5]];
getResultType[resultVector_] := resultVector[[7]];
For example
getRow[record]
gives
Out[41] = Ag
I have a list of replacemnt rules
elementList = {"Sc" -> 1, "Ti" -> 2, "V" -> 3, "Cr" -> 4, "Mn" -> 5,
  "Fe" -> 6, "Co" -> 7, "Ni" -> 8, "Cu" -> 9, "Zn" -> 10, "Y" -> 11,
  "Zr" -> 12, "Nb" -> 13, "Mo" -> 14, "Tc" -> 15, "Ru" -> 16,
  "Rh" -> 17, "Pd" -> 18, "Ag" -> 19, "Cd" -> 20, "Lu" -> 21,
  "Hf" -> 22, "Ta" -> 23, "W" -> 24, "Re" -> 25, "Os" -> 26,
  "Ir" -> 27, "Pt" -> 28, "Au" -> 29, "Hg" -> 30}
I would like to build a table where the location in the table gets identified, and the corresponding result gets put into that location of the table.
For example Ag, Ag (row, column) should put "-1.675194475" in location (19,19) (row, column) of a table.
Is there a better way to do this than with replacement rules?
Update:
Here is my current implementation to see all my data:
elementList = {"Sc" -> 1, "Ti" -> 2, "V" -> 3, "Cr" -> 4, "Mn" -> 5,
 "Fe" -> 6, "Co" -> 7, "Ni" -> 8, "Cu" -> 9, "Zn" -> 10, "Y" -> 11,
  "Zr" -> 12, "Nb" -> 13, "Mo" -> 14, "Tc" -> 15, "Ru" -> 16,
  "Rh" -> 17, "Pd" -> 18, "Ag" -> 19, "Cd" -> 20, "Lu" -> 21,
  "Hf" -> 22, "Ta" -> 23, "W" -> 24, "Re" -> 25, "Os" -> 26,
  "Ir" -> 27, "Pt" -> 28, "Au" -> 29, "Hg" -> 30};
I create lists of data for different particle sizes and energy types
data = Import["H:\\allresults.json"];
atoms32 = Select[data, StringCases[#[[1]], "32"] != {} &];
atoms79 = Select[data, StringCases[#[[1]], "60"] != {} &];
atoms32Binding =
  Select[atoms32, StringCases[#[[1]], "Binding"] != {} &];
atoms32Cohesive =
  Select[atoms32, StringCases[#[[1]], "Cohesive"] != {} &] ;
atoms79Binding =
  Select[atoms79, StringCases[#[[1]], "Binding"] != {} &];
atoms79Cohesive =
  Select[atoms79, StringCases[#[[1]], "Cohesive"] != {} &];
mat = Outer[List, elements, elements];
Is there a more elegant way to do this? I intend to do more energy calculations of different types in the future (vacancy formation energy etc). Is it possible to write it such that the data is automatically partitioned out into lists for each size and type?
rules79Binding =
  Cases[atoms79Binding, {__, "M1" -> e1_, "M2" -> e2_, __,
     "result" -> val_, __} :> {e1, e2} ->
     ToExpression@val, \[Infinity]];
rules79Cohesive =
  Cases[atoms79Cohesive, {__, "M1" -> e1_, "M2" -> e2_, __,
     "result" -> val_, __} :> {e1, e2} ->
     ToExpression@val, \[Infinity]];
rules32Binding =
  Cases[atoms32Binding, {__, "M1" -> e1_, "M2" -> e2_, __,
     "result" -> val_, __} :> {e1, e2} ->
     ToExpression@val, \[Infinity]];
rules32Cohesive =
  Cases[atoms32Cohesive, {__, "M1" -> e1_, "M2" -> e2_, __,
     "result" -> val_, __} :> {e1, e2} ->
     ToExpression@val, \[Infinity]];
This also suffers from exactly the same repetitive line with the only thing that changes between the lines is the list.
Finally I plot all the data
ArrayPlot[mat /. rules79Binding /. {_, _} -> 0,
 ColorFunction -> (Blend[{Blue, Red}, #] &),
 ColorRules -> {0 -> White}, Mesh -> True, Frame -> True,
 FrameTicks -> ({#, #} &@Transpose@{Range@Length@elements, elements}),
  PlotRangePadding -> None, ImageSize -> 500,
 PlotLabel -> "19M1@60M2 Binding Energy"]
ArrayPlot[mat /. rules79Cohesive /. {_, _} -> 0,
 ColorFunction -> (Blend[{Blue, Red}, #] &),
 ColorRules -> {0 -> White}, Mesh -> True, Frame -> True,
 FrameTicks -> ({#, #} &@Transpose@{Range@Length@elements, elements}),
  PlotRangePadding -> None, ImageSize -> 500,
 PlotLabel -> "19M1@60M2 Cohesive Energy"]
ArrayPlot[mat /. rules32Binding /. {_, _} -> 0,
 ColorFunction -> (Blend[{Blue, Red}, #] &),
 ColorRules -> {0 -> White}, Mesh -> True, Frame -> True,
 FrameTicks -> ({#, #} &@Transpose@{Range@Length@elements, elements}),
  PlotRangePadding -> None, ImageSize -> 500,
 PlotLabel -> "6M1@32M2 Binding Energy"]
ArrayPlot[mat /. rules32Cohesive /. {_, _} -> 0,
 ColorFunction -> (Blend[{Blue, Red}, #] &),
 ColorRules -> {0 -> White}, Mesh -> True, Frame -> True,
 FrameTicks -> ({#, #} &@Transpose@{Range@Length@elements, elements}),
  PlotRangePadding -> None, ImageSize -> 500,
 PlotLabel -> "6M1@32M2 Cohesive Energy"]
I have not put pictures up of each plot so that I do not make the post too long.
Also, How can I map specific numerical values over color gradients. For example, for the binding energies, {-1,-2} blends through green. {-2,-3} blends through yellow {-3,-5}, blends through orange, {-5, -10} blends through red, and {-10, infinity} is black.


recordneeds an extra{. I couldn't add it as I can only edit with a minimum of 6 characters. $\endgroup$Import[]of your source data. Can you maybe give at least an example file we can pull data from? $\endgroup$