0
$\begingroup$

Consider some audio file, e.g.,

file = Audio[File["ExampleData/car.mp3"]]

Is it possible to represent its signal in a form

$f(t) = \sum_{n = n_{\text{min}}}^{n_{\text{max}}}a_{n}e^{int}$,

where $t$ denotes time, using Mathematica? I.e., to calculate the amplitudes $a_{n}$

$\endgroup$

1 Answer 1

4
$\begingroup$

Read your data:

data= Audio[File["ExampleData/car.mp3"]]

Next we extract the numeric data:

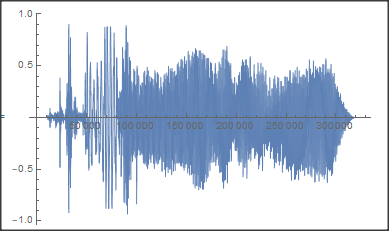
(numdat=AudioData[file]) // ListLinePlot

For the FFT we simply say:

fft= Fourier[numdat];

This will give you the "an". However, take care to read the help about the conventions used. The "an" are stored in order from DC (frequency zero) to higher frequencies up to the max and then down again.

$\endgroup$
4
  • $\begingroup$ Thanks! Would you please be so kind to answer the following questions? 1) If AudioData contains two tables, does this mean that the tables are for channel 1 and channel 2? 2) Is the maximal frequency omega_max equal to Length[fft[[1]]]/2? 3) After the Length[fft[[1]]]/2, do the amplitudes correspond to frequencies -1, -2,...-omega_max? $\endgroup$ Commented May 2, 2021 at 17:44
  • 1
    $\begingroup$ 1) Yes, one table per channel.2) The real frequency depends of course on the sampling during recording. You can only speak about a relative frequency. But you are right, the coefficient belonging to the highest frequency is at 1/2 (data length -1). The (-1) is due to the DC term. If the data length is even, there is one highest term, if odd, then there are two. 3) No Assuming an odd data length, after the highest pos. freq. comes the highest negative frequency, then second highest,.. decreasing. $\endgroup$ Commented May 2, 2021 at 19:56
  • $\begingroup$ Thanks again. May I please ask you another question: the frequencies $\omega = 0,\pm 1, \dots$, in which units they are given? Hz, or mHz, or? $\endgroup$ Commented May 3, 2021 at 16:25
  • 1
    $\begingroup$ As the data does not know, how fast it was sampled, there is no absolute unit. The only facts you know are: The highest frequency has a phase increment of Pi from one sample to the next. The whole data is periodic and corresponds to the base frequency. If you assume a time increment of 1 between samples, then the highest frequency is 1/2 (the Nyquist frequency, higher frequencies are aliased). Of course, if you know the sample rate, you can add back the real frequency. $\endgroup$ Commented May 3, 2021 at 19:33

Your Answer

By clicking “Post Your Answer”, you agree to our terms of service and acknowledge you have read our privacy policy.

Not the answer you're looking for? Browse other questions tagged or ask your own question.