3
$\begingroup$

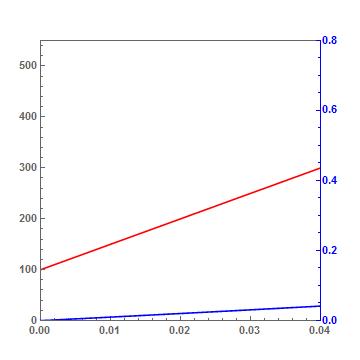
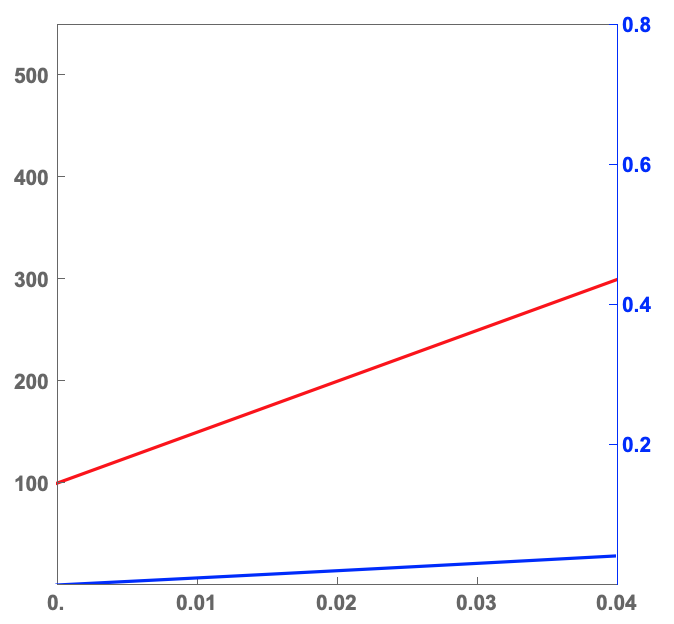
I have two plots, as seen below, Plot1 and Plot2 with a common x-axis. Each plot has a different range of y-axis and I overlay them. I want to remove the minor ticks from the frames of each plot and then overlay. How do I do this?

ClearAll["Global`*"]
xaxis1 = 0;
xaxis2 = 0.04;
yaxis1 = 0;
yaxis2 = 550;
PlotA = Plot[{5000*Sa + 100 }, {Sa, xaxis1, xaxis2 }, 
  PlotStyle -> Red, 
  PlotRange -> {{xaxis1, xaxis2}, {yaxis1, yaxis2}}, 
  LabelStyle -> {FontSize -> 12, Bold}, Frame -> True]

yaxis1 = 0;
yaxis2 = 0.8;
PlotB = Plot[{Sa^2 + Sa }, {Sa, xaxis1, xaxis2 }, PlotStyle -> Blue, 
  PlotRange -> {{xaxis1, xaxis2}, {yaxis1, yaxis2}}, 
  LabelStyle -> {FontSize -> 12, Bold}, Frame -> True]

Plot1 = Show[PlotA, LabelStyle -> {FontSize -> 10.5, Bold}, 
   Frame -> {{True, False}, {True, True}}, ImagePadding -> 40, 
   FrameTicks -> {{All, All}, {All, None}}, AspectRatio -> 1];

Plot2 = Show[PlotB, LabelStyle -> {FontSize -> 10.5, Bold}, 
   FrameTicks -> {{None, All}, {None, All}}, 
   Frame -> {{False, True}, {False, False}}, ImagePadding -> 40, 
   FrameStyle -> {{Automatic, Blue}, {Automatic, Automatic}}, 
   AspectRatio -> 1];
Overlay[{Plot1, Plot2}]

enter image description here

$\endgroup$
4
  • 1
    $\begingroup$ Please supply code and example of the Plots $\endgroup$
    – Jagra
    Commented Dec 11, 2020 at 23:36
  • $\begingroup$ Take a look at the Resource Function CombinePlots. $\endgroup$ Commented Dec 11, 2020 at 23:40
  • $\begingroup$ @Jagra I have edited the question to include the code and sample plot $\endgroup$
    – grading
    Commented Dec 12, 2020 at 1:01
  • $\begingroup$ @RohitNamjoshi It wasn't as useful since it doesn't address the question with regard to the Tick plots. I'm already using Overlay to combine plots $\endgroup$
    – grading
    Commented Dec 12, 2020 at 1:02

2 Answers 2

3
$\begingroup$

In the CustomTicks package you can set the option ShowMinorTicks to True or False.

Another way is to list where you want the frame ticks to appear:

Plot1 = Show[PlotA, LabelStyle -> {FontSize -> 10.5, Bold}, 
   Frame -> {{True, False}, {True, True}}, ImagePadding -> 40, 
   FrameTicks -> {{{100, 200, 300, 400, 500}, 
      All}, {{0.00, 0.01, 0.02, 0.03, 0.04}, None}}, AspectRatio -> 1];

Plot2 = Show[PlotB, LabelStyle -> {FontSize -> 10.5, Bold}, 
   FrameTicks -> {{None, {0.2, 0.4, 0.6, 0.8}}, {None, All}}, 
   Frame -> {{False, True}, {False, False}}, ImagePadding -> 40, 
   FrameStyle -> {{Automatic, Blue}, {Automatic, Automatic}}, 
   AspectRatio -> 1];

enter image description here

$\endgroup$
2
  • $\begingroup$ How can I make the label print as "0.00" and not "0." $\endgroup$
    – grading
    Commented Dec 12, 2020 at 4:55
  • $\begingroup$ @Biotechgeek : The FrameTicks option has four parts: {{left, right}, {bottom, top}}. Change the specification for the bottom frame ticks to {{{0, "0.00"}, 0.01, 0.02, 0.03, 0.04}. The 0.01, 0.02, ... say to put the label "0.01 at 0.01, "0.02" at 0.02, ... . The {0, "0.00"} says to put "0.00" at 0. $\endgroup$ Commented Dec 12, 2020 at 8:34
3
$\begingroup$
{xrange, yrange1, yrange2} = {{0, .04}, {0, 550}, {0, .8}};

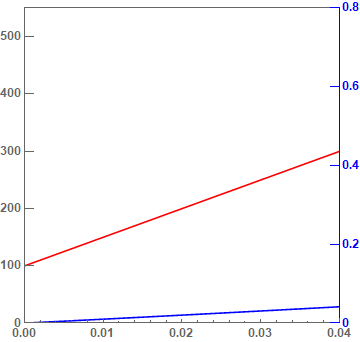
You can use a single Plot using the following steps:

  1. Define a scaling function to rescale y values from the range {0, .8} to the range {0, 550}:
scalingFunction = Rescale[#, yrange2, yrange1] &;
  1. Use {5000*Sa + 100, scalingFunction[Sa^2 + Sa]} in the first argument of Plot;
  2. Use the function Charting`ScaledTicks with the option "TicksLength" -> {.03, 0} to get ticks with only the major ticks, and
  3. Use Charting`ScaledTicks[{scalingFunction, InverseFunction[scalingFunction]}] to scale back the blue y-axis.

scalingFunction = Rescale[#, yrange2, yrange1] &;

Plot[{5000*Sa + 100, scalingFunction[Sa^2 + Sa]}, {Sa, xaxis1, xaxis2}, 
 AspectRatio -> 1, 
 PlotStyle -> {Red, Blue}, 
 PlotRange -> {xrange, yrange1}, 
 LabelStyle -> {FontSize -> 12, Bold},
 Frame -> True, 
 FrameStyle -> {{Automatic, Blue}, {Automatic, Automatic}}, 
 FrameTicks -> {{Charting`ScaledTicks[{Identity, Identity}, "TicksLength" -> {.03, 0}], 
    Charting`ScaledTicks[{scalingFunction, InverseFunction[scalingFunction]}, 
     "TicksLength" -> {.03, 0}]}, {Automatic, None}}]

enter image description here

$\endgroup$

Your Answer

By clicking “Post Your Answer”, you agree to our terms of service and acknowledge you have read our privacy policy.

Not the answer you're looking for? Browse other questions tagged or ask your own question.