4
$\begingroup$

I developed a code to display a progress bar, percentage and time dynamically when I am running a plot that calculates things (using user defined function called computethings). It works nicely in serial mode or when I am using Table function. However, in parallel mode (2 kernels or threads) or using ParallelTable function, only time display works. The progress bar and percentage does not work. I tried other examples in stackexchange but it does not work in my code that works fine in serial mode. Obviously, a function called ProgressIndicator does not work. Any suggestions are greatly appreciated. Below is a sample code:

ac = 2;
bc = 2;
acstep = 0.1;
bcstep = 0.1;
test = 10;

answer[newu_, newv_] :=
NDSolve[{u'[t] == newu + v[t]*Sin[t + u[t]],
v'[t] == newv*u[t]*newv*Cos[t + v[t]], u[0] == newu,
v[0] == newv}, {u, v}, {t, test - 5, test + 5},
Method -> Automatic];

goldmine = {{9, 11}, {-11, -9}};

closeanswer = Nearest[goldmine -> Automatic] /* First;

computethings[startu_, startv_] :=
closeanswer[{u[test], v[test]} /. answer[startu, startv] // Flatten,
1];

SetAttributes[ShowProgress,HoldAll];

ShowProgress[a_,
{i_,min_,max_}]:=With[{progressStartTime=AbsoluteTime[]},Monitor[a,Dynamic[Refresh[Row[{Pro
gressIndicator[Dynamic[i],{min,max}],{((i+Abs[min])/(max-min)*100)//N,"%
",duration=N[AbsoluteTime[]-progressStartTime],"seconds"}}//Flatten," "],UpdateInterval→0.25]]]]

ShowProgress[
ArrayPlot[
Table[computethings[x, y], {x, -ac, ac, acstep}, {y, -bc, bc, bcstep}],
ColorRules -> {1 -> Yellow, 2 -> Blue, 3 -> Brown}], {x, -ac, ac}]

while calculating the answer, it shows this :

tableindicator

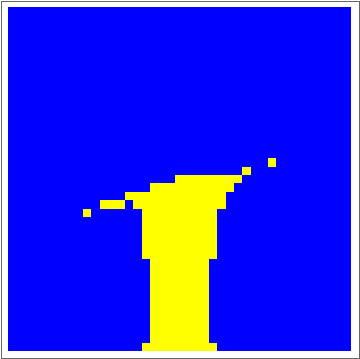
Once completed, it plots goldmine:

answer

Running again but using ParallelTable or:

ShowProgress[
ArrayPlot[
ParallelTable[computethings[x, y], {x, -ac, ac, acstep}, {y, -bc, bc, bcstep}],
ColorRules -> {1 -> Yellow, 2 -> Blue, 3 -> Brown}], {x, -ac, ac}]

while calculating the answer, it shows this:

paralleltableindicator

The progress indicator is not active. The percentage is not active. However, the timing runs fine.

The output is the same as before or :

answer

Like I mentioned before, the culprit is probably Dynamic[i]. I attempted defining i as shared variable but still I made no progress.

$\endgroup$
7
  • 2
    $\begingroup$ there's a question on this every couple of months, but no compromise free solution mathematica.stackexchange.com/search?q=monitor+paralleltable $\endgroup$
    – Szabolcs
    Commented Jul 30, 2020 at 6:11
  • 1
    $\begingroup$ I think there's something for ParallelMap in Wolfram Funcions Repository but I don't have time to search for it atm. $\endgroup$
    – Kuba
    Commented Jul 30, 2020 at 7:17
  • 3
    $\begingroup$ @Kuba ResourceFunction["ParallelMapMonitored"] $\endgroup$
    – flinty
    Commented Jul 30, 2020 at 15:36
  • $\begingroup$ @flinty , thanks for response. Your suggestions require a complete rewrite of the code that partially works. I am trying to avoid that. I know that the source of trouble in my code when ParallelTable is used instead Table is in the ProgressIndicator code line. More specifically, Dynamic[i]. the variable i is not incremented in ParallelTable mode. $\endgroup$
    – Aschoolar
    Commented Jul 31, 2020 at 12:16
  • $\begingroup$ @ Szabolcs, thanks for links, I looked into them and so far can't figure it out. $\endgroup$
    – Aschoolar
    Commented Jul 31, 2020 at 12:16

1 Answer 1

5
$\begingroup$

As @Kuba mentioned there is a ResourceFunction called ParallelMapMonitored available in the functions repository. Here's an example I concocted that uses it:

computethings[x_, y_] := x*y;
{ac, bc} = {1, 1};
{acstep, bcstep} = {.005, .005};
ParallelMapMonitored = ResourceFunction["ParallelMapMonitored"];
grid = Table[{x, y}, {x, -ac, ac, acstep}, {y, -bc, bc, bcstep}];
result = ParallelMapMonitored[computethings @@ # &, Flatten[grid, 1]];
result = ArrayReshape[result, Most[Dimensions[grid]]];
MatrixPlot@result

Unfortunately it doesn't have a level argument, so you cannot shorten this code much. This example below that should square all elements in a 100x100 matrix of random numbers won't work:

ParallelMapMonitored[#^2 &, RandomReal[1, {100, 100}], {2}]
$\endgroup$
3
  • 1
    $\begingroup$ flinty, there’s also MonitorProgress, it might be valuable to include this in your answer also. $\endgroup$ Commented Jul 31, 2020 at 9:17
  • $\begingroup$ @CATrevillian The parallel examples there do not work for me. MonitorProgress[Parallelize@Table[x^2, {x, -10, 10, 0.05}]] fails in 12.1.1 saying MonitorProgress::injectFailed as does MonitorProgress[ParallelTable[x^2, {x, -10, 10, 0.05}]] as does MonitorProgress[Table[$KernelID, 20], Parallelization -> {Method -> "FinestGrained"}] and it returns all zeros. $\endgroup$
    – flinty
    Commented Jul 31, 2020 at 11:56
  • 2
    $\begingroup$ Must be new issue with 12.1.1 then, I thought I had done it with 12.0 at least. Hopefully Lukas Lang can see this somehow $\endgroup$ Commented Jul 31, 2020 at 12:51

Your Answer

By clicking “Post Your Answer”, you agree to our terms of service and acknowledge you have read our privacy policy.

Not the answer you're looking for? Browse other questions tagged or ask your own question.