6
$\begingroup$

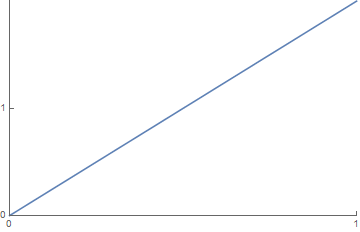
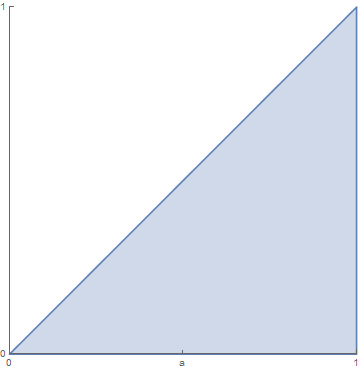
I am trying to get a label "0" at the origin to display. Currently it is not displaying (code below). Other tick labels work fine, just not at zero. I suppose I could use Epilog to add text at (0,0), but then I would have to style the text similarly to the tick labels. Any ideas how to get the tick at (0,0) to show itself?

plot1 = Plot[2*x, {x, 0, 1}, Ticks -> {{{0,"0"}, 1}, {0, 1}}]
plot2 = RegionPlot[{x >= y}, {x, 0, 1}, {y, 0, 1}, Frame -> False, 
  Axes -> True, Ticks -> {{{0, 0}, {0.5, "a"}, 1}, {0, 1}}]
$\endgroup$

1 Answer 1

7
$\begingroup$
Plot[2*x, {x, 0, 1}, Ticks -> {{{0, "0"}, 1}, {0, 1}},  
 PlotRangePadding -> 0, PlotRangeClipping -> False]

enter image description here

RegionPlot[{x >= y}, {x, 0, 1}, {y, 0, 1}, Frame -> False, 
 Axes -> True, Ticks -> {{{0, 0}, {0.5, "a"}, 1}, {0, 1}}, 
 PlotRangePadding -> 0, PlotRangeClipping -> False]

enter image description here

$\endgroup$

Your Answer

By clicking “Post Your Answer”, you agree to our terms of service and acknowledge you have read our privacy policy.

Not the answer you're looking for? Browse other questions tagged or ask your own question.