2
$\begingroup$

I have this code:

AllData = Import["https://pastebin.com/raw/TARH18Hm", "Table"];
Do[Spec[2*i] = AllData[[All, (2*i + 1) ;; (2*i + 2)]], {i, 0, 9}];
peakpositions = FindPeaks[Spec[18][[All, 2]], 3, 1, 400];
peakswavelength = Spec[18][[#1, 1]] & @@@ peakpositions;
peaks = Transpose[{peakswavelength, peakpositions[[All, 2]]}];
ListPlot[{Spec[18], Callout[#, Rotate[#[[1]], 0], Above] & /@ peaks}, 
PlotRange -> All, Joined -> {True, False}]

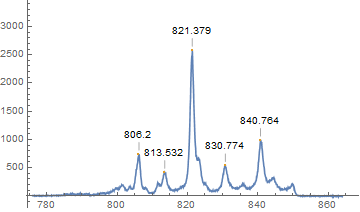
Which generates this:

enter image description here

I labeled five major peaks but I want to replace the numeric labels with five markers like a filled circle, a filled square and so on. How can I do that?

$\endgroup$

1 Answer 1

3
$\begingroup$

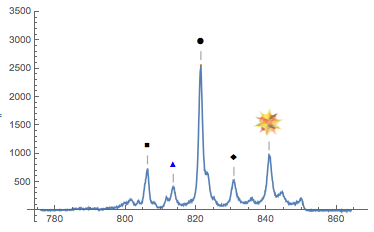
The second argument to Callout can be any expression. In your case you are just using the wavelength (#[[1]]) as the label. To use different labels, you can do something like this:

labels = {"\[FilledSquare]",  Style["\[FilledUpTriangle]", Blue], 
          "\[FilledCircle]", "\[FilledDiamond]",
          Import @ "ExampleData/spikey.tiff"};
labeledPeaks = MapThread[Callout[#, #2, Above]&,
    {peaks, labels}
];
ListPlot[{Spec @ 18, labeledPeaks},
    PlotRange -> All,
    Joined -> {True, False}
]

enter image description here

$\endgroup$

Your Answer

By clicking “Post Your Answer”, you agree to our terms of service and acknowledge you have read our privacy policy.

Not the answer you're looking for? Browse other questions tagged or ask your own question.