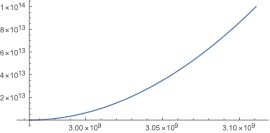
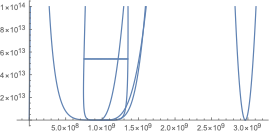
I have tried to solve a pair of simultaneous equations in Mathematica. I was able to solve these equations but I was unable to plot them in the way I wanted. My equations gave me solutions for two variables a1 and a2 and I wanted to see how the Absolute square of these variables changed as a changed the parameter s^2 My program is as follows
Clear["Global`*"]

k = 2*Pi*10^6;
kl = Pi*10^6;
ke = Pi*10^6;
omm = 100*Pi*10^6;
gm = 20*Pi*10^3;
G = 12*Pi*10^18;
m = 6*10^(-9);
h = 6.626*10^(-34);
gamma = (h*G^2)/(m*omm^2);
del = 0;


sol = Solve[((I*(del + gamma*Abs[a1]^2) - k/2) a1 - (ke/2) a2 +
Sqrt[ke] s == 0) &&
((I*(del + gamma*Abs[a2]^2) - k/2) a2 - (ke/2) a1 +
Sqrt[ke] s == 0), {a1, a2}];

ParametricPlot[{Evaluate[Abs[a1 /. sol]^2], s^2}, {s, 0, 10^7}]
I expected this program to plot Abs[a1]^2 against s^2. But instead, I get a blank plot. I would be very glad if anyone could help me with this and explain why I was unable to plot this graph.


