2
$\begingroup$

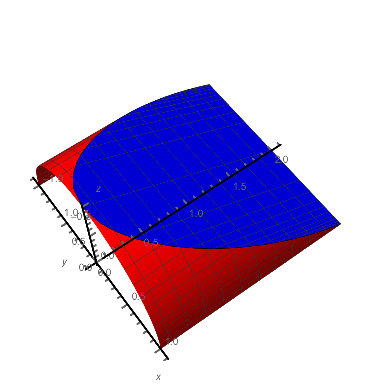
I would like to plot the intersection between the surface $z=-\frac{y}{2}+1$ and the surface $z=\sqrt{1-x^{2}}$.

This is what I tried:

A1 := ParametricPlot3D[{Sqrt[1 - z^2], y, z}, {y, 0, 2}, {z, 
    0, -y/2 + 1}, PlotStyle -> {Red}, PlotStyle -> Thickness[0.02], 
   AxesStyle -> Thick, Boxed -> False, AxesOrigin -> {0, 0, 0}, 
   AxesLabel -> {x, y, z}];
A2 := ParametricPlot3D[{-Sqrt[1 - z^2], y, z}, {y, 0, 2}, {z, 
    0, -y/2 + 1}, PlotStyle -> {Red}, PlotStyle -> Thickness[0.02], 
   AxesStyle -> Thick, Boxed -> False, AxesOrigin -> {0, 0, 0}, 
   AxesLabel -> {x, y, z}];
A3 := ParametricPlot3D[{x, y, -y/2 + 1}, {y, 0, 
    2}, {x, -Sqrt[y - y^2/4], Sqrt[y - y^2/4]}, PlotStyle -> {Blue}, 
   PlotStyle -> Thickness[0.02], AxesStyle -> Thick, Boxed -> False, 
   AxesOrigin -> {0, 0, 0}, AxesLabel -> {x, y, z}];
Show[A1, A2, A3]

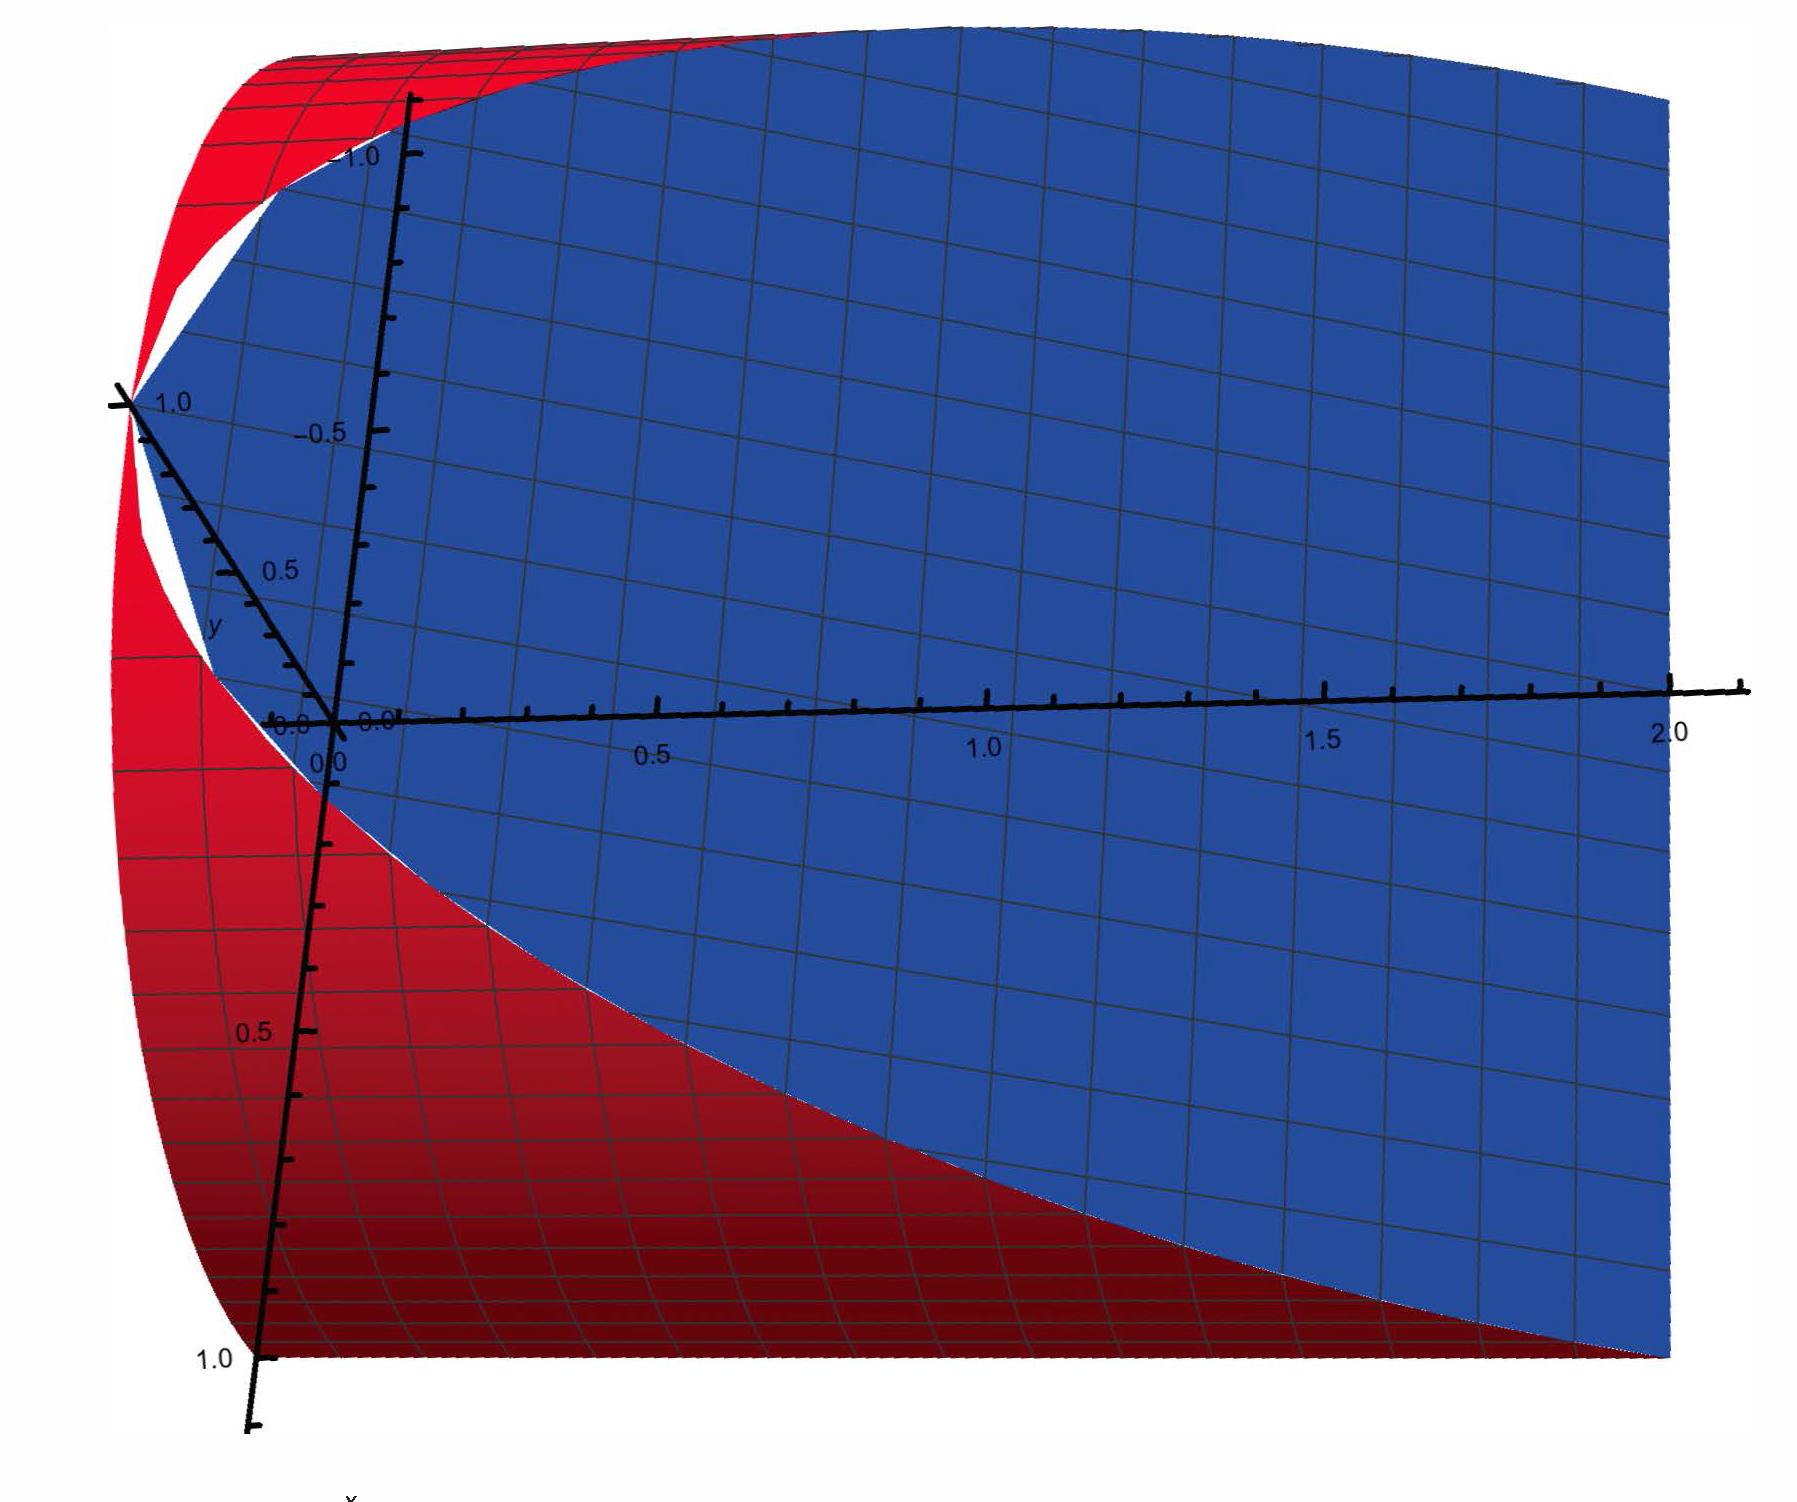
Here is the picture:

enter image description here

My question: how can we remove the white gap shown in the picture?

Thanks for any hint.

$\endgroup$
4
  • 2
    $\begingroup$ Add PlotPoints->100 in A3-plot! $\endgroup$ Commented Jan 20, 2020 at 10:46
  • $\begingroup$ One would refine the plotting more by increasing the plot points by adding an option: PlotPoints -> 100 for example $\endgroup$
    – SHuisman
    Commented Jan 20, 2020 at 10:46
  • $\begingroup$ @Ulrich That is so great. $\endgroup$
    – Binjiu
    Commented Jan 20, 2020 at 10:50
  • $\begingroup$ The proper way is to get them to use exactly the same vertices on the edge. It's not a simple matter to get them to do it. Even with a lot of plot points, you still get the background showing through sometimes. And if you want to create a region with it, you need to close up the holes. $\endgroup$
    – Michael E2
    Commented Jan 20, 2020 at 14:29

3 Answers 3

1
$\begingroup$

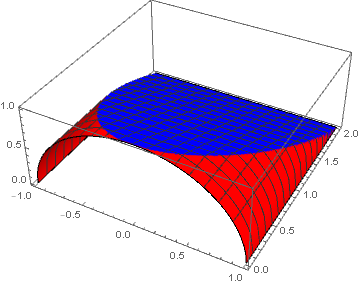
The OP's solution is doing too much work. In fact, this picture can be generated with a single Plot3D[] call, through the judicious use of Min[] and a straightforward ColorFunction construction:

Plot3D[Min[Sqrt[1 - x^2], 1 - y/2], {x, -1, 1}, {y, 0, 2}, 
       ColorFunction -> Function[{x, y, z}, If[(1 - y/2)^2 < 1 - x^2, Blue, Red]], 
       ColorFunctionScaling -> False, Exclusions -> None, PlotPoints -> 75]

plot of cut-off surface

$\endgroup$
1
$\begingroup$

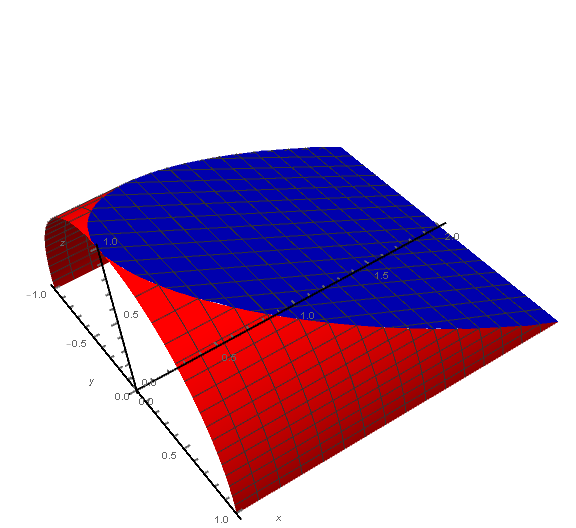
Here's a way, but you lose the misaligned mesh lines:

A1 = ParametricPlot3D[{Sqrt[1 - z^2], y, z}, {y, 0, 2}, {z, 
    0, -y/2 + 1}, PlotStyle -> {Red}, PlotStyle -> Thickness[0.02], 
   AxesStyle -> Thick, Boxed -> False, AxesOrigin -> {0, 0, 0}, 
   AxesLabel -> {x, y, z}, Mesh -> None, BoundaryStyle -> Green];
A2 = ParametricPlot3D[{-Sqrt[1 - z^2], y, z}, {y, 0, 2}, {z, 
    0, -y/2 + 1}, PlotStyle -> {Red}, PlotStyle -> Thickness[0.02], 
   AxesStyle -> Thick, Boxed -> False, AxesOrigin -> {0, 0, 0}, 
   AxesLabel -> {x, y, z}, Mesh -> None, BoundaryStyle -> Green];
boundaryPoints = Join[
   First@Cases[Normal@A1,
     Line[p_] :> DeleteCases[p,
       {x_Real, y_Real, z_Real} /;
        (z == 0 && y != 2) || (y == 0 && z != 0 && z != 1)],
     Infinity],
   Reverse@First@Cases[Normal@A2,
      Line[p_] :> DeleteCases[p,
        {x_Real, y_Real, z_Real} /;
         (z == 0 && y != 2) || (y == 0 && z != 0 && z != 1)],
      Infinity]
   ];
Show[
 DeleteCases[A1, _Line, Infinity],  (* remove green boundary *)
 DeleteCases[A2, _Line, Infinity],
 Graphics3D[{Blue, Polygon@boundaryPoints}]
 ]
enter image description here

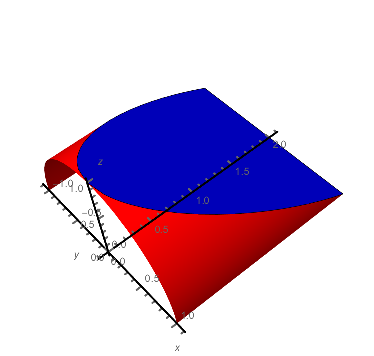
Here's a way to get the meshes aligned:

A1 = ParametricPlot3D[{Sqrt[1 - z^2], y, z}, {y, 0, 2}, {z, 
    0, -y/2 + 1}, PlotStyle -> {Red}, PlotStyle -> Thickness[0.02], 
   AxesStyle -> Thick, Boxed -> False, AxesOrigin -> {0, 0, 0}, 
   AxesLabel -> {x, y, z}, Mesh -> None, BoundaryStyle -> Green];
ypts = Cases[Normal@A1,
     Line[p_] :> DeleteCases[p,
       {x_Real, y_Real, z_Real} /;
        (z == 0 && y != 2) || (y == 0 && z != 0 && z != 1)],
     Infinity][[1, All, 2]] // DeleteDuplicates;
mf = {#2 &, #3 &};
mesh = {Subdivide[-2, 2, 21], Subdivide[0, 1, 11]};
A3 = ListPlot3D[Flatten[Table[
     Table[{x, y, -y/2 + 1},
      {x, 
       Subdivide[-Sqrt[y - y^2/4], Sqrt[y - y^2/4], 
        Sqrt[y - y^2/4]/16 /. {dx_ /; dx == 0 :> 1, _ -> 10}]}],
     {y, ypts}], 1],
   PlotStyle -> {Blue}, PlotStyle -> Thickness[0.02], 
   AxesStyle -> Thick, AxesOrigin -> {0, 0, 0}, AxesLabel -> {x, y, z},
   MeshFunctions -> {#1 &, #2 &}, 
   Mesh -> {Join[-#, #] &@Sqrt[1 - Last@mesh^2], First@mesh}];
A1 = ParametricPlot3D[{Sqrt[1 - z^2], y, z}, {y, 0, 2}, {z, 
    0, -y/2 + 1}, PlotStyle -> {Red}, PlotStyle -> Thickness[0.02], 
   AxesStyle -> Thick, Boxed -> False, AxesOrigin -> {0, 0, 0}, 
   AxesLabel -> {x, y, z},
   MeshFunctions -> {#2 &, #3 &}, Mesh -> mesh];

Show[
 A1,
 A1 /.    (* reflect A1 and its VertexNormals *)
  GraphicsComplex[p_, g_, opts___] :> 
   GraphicsComplex[p.DiagonalMatrix[{-1, 1, 1}], 
    g, {opts} /. 
     HoldPattern[VertexNormals -> v_] :> 
      VertexNormals -> v.DiagonalMatrix[-{-1, 1, 1}]],
 A3]
enter image description here

$\endgroup$
1
$\begingroup$
ClearAll[fa, fb, fc]
fa[x_] := -x/2 + 1
fb[x_] := Sqrt[1 - x^2]
fc[x_] := Sqrt[x - x^2/4];
  1. You can generate the two red surfaces using a single ParametricPlot3D.
  2. You can use the option RegionFunction instead of making the range of the second parameter depend on the value of the first parameter.

p1 = ParametricPlot3D[{{fb[y], x, y}, {- fb[y], x, y}}, {x, 0, 2}, {y, 0, 1}, 
   PlotStyle -> Red, AxesLabel -> {x, y, z},
   AxesStyle -> Thick, Boxed -> False, AxesOrigin -> {0, 0, 0}, 
   RegionFunction -> (0 < #3 <= fa[#2] &)];

p2 = ParametricPlot3D[{y, x, fa[x]}, {x, 0, 2}, {y, -1, 1}, 
   PlotStyle -> Blue, 
   RegionFunction -> (-fc[#2] <= # <= fc[#2] &)];

Show[p1, p2, ImageSize -> Large]

enter image description here

$\endgroup$

Your Answer

By clicking “Post Your Answer”, you agree to our terms of service and acknowledge you have read our privacy policy.

Not the answer you're looking for? Browse other questions tagged or ask your own question.