M1 = Array[Subscript[y, #1, #2][t] &, {2, 2}];
M0 = {{1, 0.00001}, {0.00001, 0}};
ci = Thread[Flatten[M1] == Flatten[M0]] /. {t -> 0};
s = NDSolve[{ I D[M1, t] == (M''.M1 - M1.M'')/20, ci}, Variables[M1], {t, 0, 10}]
I have solved the above differential equation. It gives 4 different solutions i.e. the 4 different matrix elements of M1 as the interpolating functions.
How to plot these different solutions. I tried doing
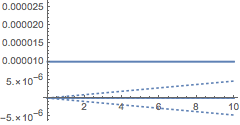
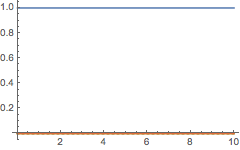
Plot[M1 /. s, {t, 0, 10}]
but it is not showing anything. Sorry I forgot to mention, M'' is defined as a matrix
M''={{3.58368*10^-6, -9.3358*10^-6}, {-9.3358*10^-6, -3.58368*10^-6}}
It is showing solution as
> {{Subscript[y, 1, 1][t] -> InterpolatingFunction[{{0., 10.}}, <>][t],


Subscript[y, 1, 2][t] -> InterpolatingFunction[{{0., 10.}}, <>][t],


 Subscript[y, 2, 1][t] -> InterpolatingFunction[{{0., 10.}}, <>][t],


 Subscript[y, 2, 2][t] -> InterpolatingFunction[{{0., 10.}}, <>][t]}}


NDSolveis not producing a solution, so there is nothing forPlotto plot. At least one problem with your code is thatMis undefined. By the way, it is prudent not to begin variable names with capital letters. $\endgroup$ReImPlotinstead ofPlot. $\endgroup$M''is shorthand forDerivative[2][M], which seems a somewhat hacky way to store a constant matrix. $\endgroup$