17
$\begingroup$

I have a vector stochastic differential equation,

$$\mathrm dq = p\,\mathrm dt\qquad q(0)=0$$ $$\mathrm dp = (-q -p)\mathrm dt+\mathrm dW\qquad p(0)=10$$

This can be entered to give me the process describing either p or q, using

proc = ItoProcess[
    {{p[t], -p[t]-q[t]}, {{0}, {1}}, XXX[t]},
    {{q, p}, {0, 10}},
    {t,0}
]

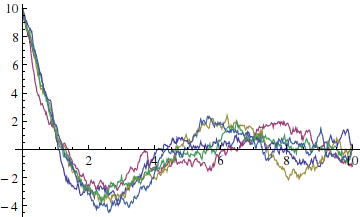
where XXX is either q or p. The solution can be plotted using the usual method (here for p) of

ListLinePlot@RandomFunction[proc, {0, 10, .02}, 10]

enter image description here

However, the situation is more difficult if I want to extract both q and p, as for each simulation it will give me a list of the type (obtained using Normal, and by setting XXX[t] to {q[t], p[t]} in the ItoProcess)

{{{t0, {q[t0], p[t0]}}, {t1, {q[t1], p[t1]}}, ...}

i.e. the times aren't properly distributed over the p/q, and as a consequence I'm having a hard time finding a good way of getting this into a plottable form.

So the questions are:

  1. Is there a nice way of getting all components out of a vector stochastic differential equation to plot them alongside each other?
  2. If there's none, what's the right hacky approach? Fiddling with Transpose and Flatten?
$\endgroup$

3 Answers 3

15
$\begingroup$

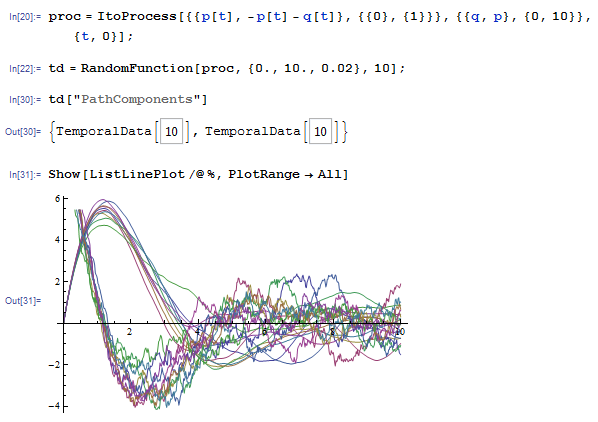
You could use "PathComponents" property of TemporalData to split the vector-valued temporal data into the list of TemporalData objects and plot those:

proc = ItoProcess[{{p[t], -p[t] - q[t]}, {{0}, {1}}}, {{q, p}, {0, 
     10}}, {t, 0}];

td = RandomFunction[proc, {0., 10., 0.02}, 10];

td["PathComponents"]

enter image description here

$\endgroup$
1
  • $\begingroup$ Ah, I forgot looking at TemporalData, of which I assumed it was some internal form unsuitable for direct manipulation. Turns out the documentation on it is quite complex. $\endgroup$
    – David
    Commented Dec 4, 2012 at 17:30
6
$\begingroup$

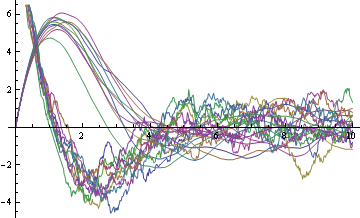
Please confirm if this is what you were looking for

proc = ItoProcess[{{p[t], -p[t] - q[t]}, {{0}, {1}}, {q[t], 
    p[t]}}, {{q, p}, {0, 10}}, {t, 0}];

data = RandomFunction[proc, {0, 10, 0.02}, 10];

You could do

Plot[Through@data["PathFunction", All][t], {t, 0, 10}, Evaluated -> True]

Mathematica graphics

$\endgroup$
3
$\begingroup$

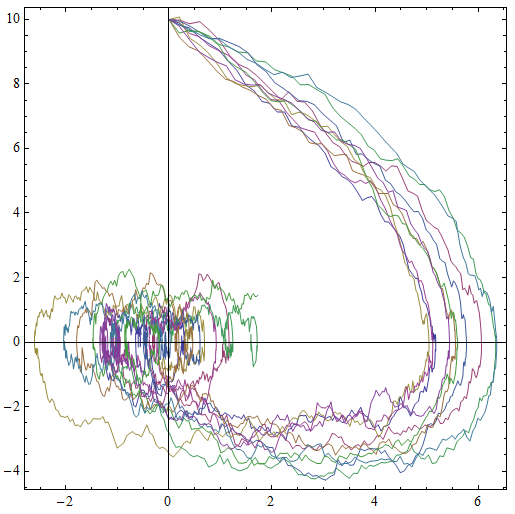
Another way to visualize this is in the parametric phase space:

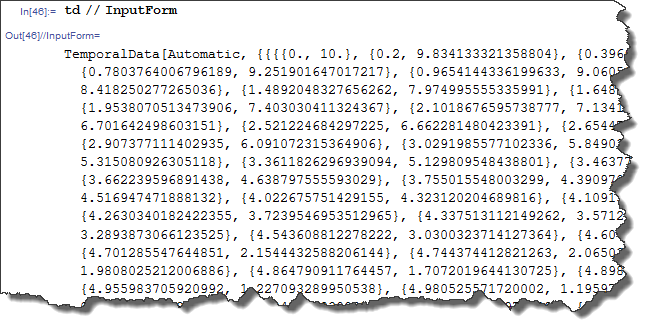
ListLinePlot[td[[2, 1]], Frame -> True, AspectRatio -> 1, PlotRange -> All]

enter image description here

---------- Comment reponse ----------

We can check the structure of underlying expression with InputForm and then it is straightforward to use Part to extract the sub-expressions:

enter image description here

$\endgroup$
3
  • 1
    $\begingroup$ How did you get the [[2,1]] part? A little more explanation and this would make a nice remark. $\endgroup$
    – David
    Commented Dec 4, 2012 at 18:45
  • $\begingroup$ @David I updated the answer $\endgroup$ Commented Dec 4, 2012 at 19:02
  • $\begingroup$ Oh, I wasn't expecting you used brute force here. $\endgroup$
    – David
    Commented Dec 4, 2012 at 19:43

Your Answer

By clicking “Post Your Answer”, you agree to our terms of service and acknowledge you have read our privacy policy.

Not the answer you're looking for? Browse other questions tagged or ask your own question.