0
$\begingroup$

I would like to create the projection of a solution in plane from the differential equation set solution. However, the way I did it is not as I would like it, it does not have a smoothness.

Here's the method I used:

eps = 10^-10; end = 10;
sol:= NDSolve[{g'[r] == a[r]*g[r]/r, a'[r]/r == g[r]^2 - 1, a[eps] == 1,
g[end] == 1},{a[r], g[r]}, {r, eps, end}, Method -> {"Shooting", 
"StartingInitialConditions" -> {a[end] == eps, g[end] == (1 - eps)}}]
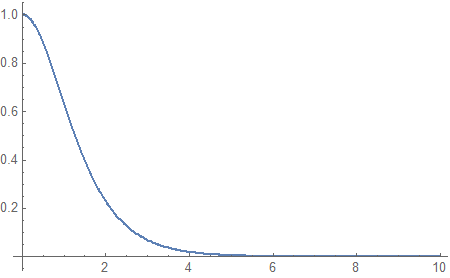
Plot[Evaluate[a[r] /. sol], {r, eps, end}, PlotRange -> All]

enter image description here

The original topic for this EDO solution is here: "https://mathematica.stackexchange.com/a/179911/59596".

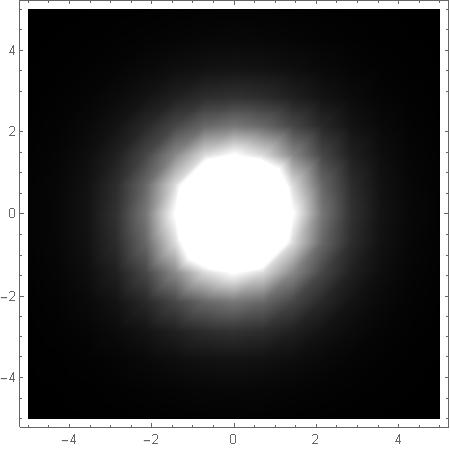
I have extracted the data for a table and, then, I tried to make the projected plot on the plane:

data = Table[Evaluate[a[r] /. sol], {r, 1, 10}]}
fR = Interpolation[data];
DensityPlot[fR[Sqrt[x^2 + y^2]], {x, -5, 5}, {y, -5, 5},ColorFunction -> GrayLevel]

enter image description here

Is there a better way to do this? Thanks for any help.

$\endgroup$

1 Answer 1

2
$\begingroup$

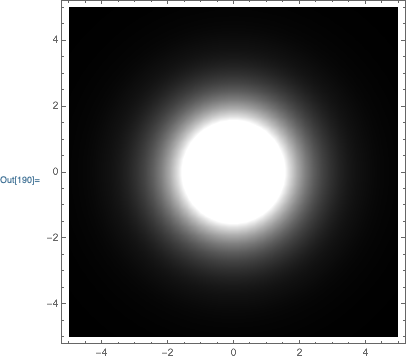
The basic answer to your question is to use the option PlotPoints to increase the number of initial points to use:

DensityPlot[
    fR[Sqrt[x^2 + y^2]],
    {x,-5,5}, {y,-5,5},
    PlotPoints->40,
    ColorFunction->GrayLevel
]

enter image description here

That being said, I would do things differently. First, when solving the ODE I would use NDSolveValue, and I would use set, so that the ODE is only solved once:

eps=10^-10; end=10;
{asol, gsol} = NDSolveValue[
    {g'[r] == a[r]*g[r]/r, a'[r]/r == g[r]^2-1, a[eps] == 1, g[end] == 1},
    {a, g}, 
    {r, eps, end},
    Method->{"Shooting", "StartingInitialConditions"->{a[end]==eps,g[end]==(1-eps)}}
];

Then, the plot of a won't require an Evaluate or a ReplaceAll (/.):

Plot[asol[r], {r,eps,end}, PlotRange->All]

same plot as in the OP

Next, I would just use the interpolating function in your density plot (instead of creating an interpolating function from a table of values of an interpolating function)

DensityPlot[
    asol[Sqrt[x^2 + y^2]],
    {x,-5,5}, {y,-5,5},
    PlotPoints->40,
    ColorFunction->GrayLevel
]

same density plot as above

$\endgroup$
1
  • $\begingroup$ Thank you so much for your answer @Carl. I would like to take the opportunity and ask how can I change the color of the center of the density plot? I have managed to change only the color from the outside to the center. The white color in the center has always remained. Can you help me with this too? $\endgroup$
    – Andrey
    Commented Sep 30, 2019 at 0:00

Your Answer

By clicking “Post Your Answer”, you agree to our terms of service and acknowledge you have read our privacy policy.

Not the answer you're looking for? Browse other questions tagged or ask your own question.