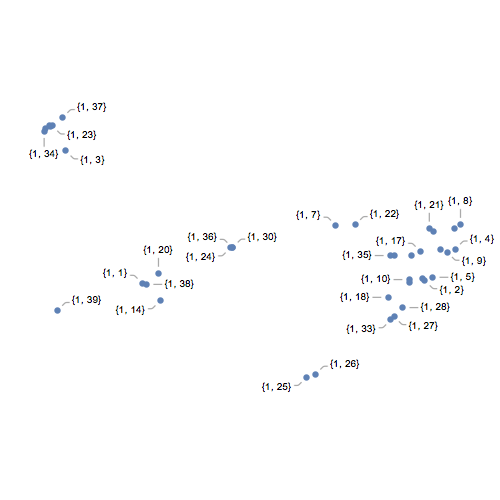
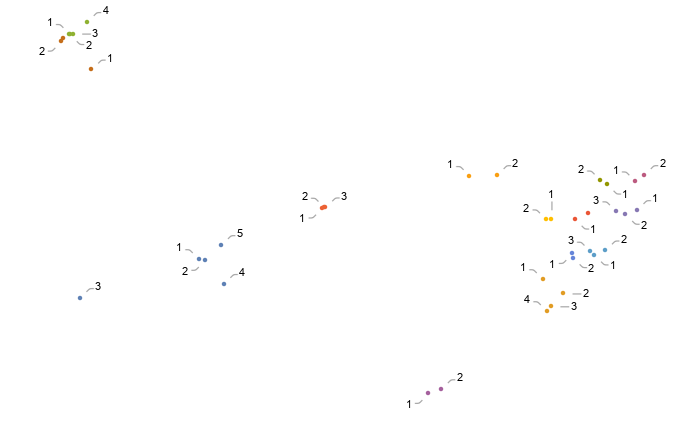
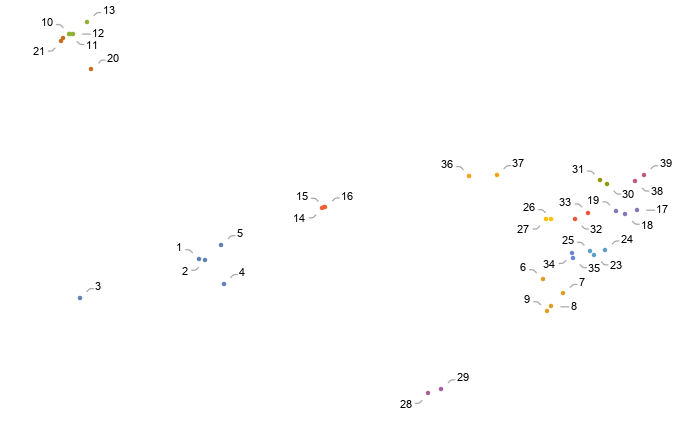
probably this question is much easier than I can imagine. I have a plot in which I added a label to each point. The label is just the coordinate of that point. I tried to replace that label in this way:
Table[ListPlot[points, ImageSize -> {500, 500}, Axes -> False,
  LabelingFunction -> functions], {functions, {(#2 &)}}]
but it is a couple of numbers (n1,n2), not only one (n1). Is it possible to set a number as first and then changing the other numbers accordingly, by assigning the numeration based on the nearest neighbours for each one?
Example: I select one point and assign it the label 1. Then, its nearest point has label 2; the nearest point of 2 has the label 3, and so on...
Many thanks for your time and for your help.
Data:
{{456.5, 552.5}, {1435.5, 565.5}, {191.5, 1186.5}, {1540.5,
  716.5}, {1462.5, 581.5}, {1536.5, 812.5}, {1126.5, 830.5}, {1558.5,
  833.5}, {1512.5, 701.5}, {1380.5, 570.5}, {1488.5, 712.5}, {1387.5,
  685.5}, {1425.5, 577.5}, {518.5, 469.5}, {136.5, 1305.5}, {1466.5,
  802.5}, {1419.5, 705.5}, {1307.5, 485.5}, {1382.5, 556.5}, {512.5,
  599.5}, {1450.5, 815.5}, {1194.5, 833.5}, {145.5, 1305.5}, {761.5,
  722.5}, {1024.5, 102.5}, {1056.5, 117.5}, {1328.5, 393.5}, {1358.5,
  436.5}, {120.5, 1291.5}, {770.5, 725.5}, {1329.5, 686.5}, {138.5,
  1302.5}, {1317.5, 378.5}, {116.5, 1280.5}, {1315.5, 685.5}, {767.5,
  724.5}, {180.5, 1345.5}, {471.5, 547.5}, {162.5, 422.5}}


