4
$\begingroup$

I have the following $3$-dimensional object defined by the inequalities:

$$ u ≥ 0, v ≥ 0, w ≥ 0, \sin u ≤ \cos v, \sin v ≤ \cos w, \sin w ≤ \cos u. $$

How can I ''visualize'' this object in 3D using Mathematica? Furthermore, can I use Mathematica to automatically calculate its volume?

$\endgroup$
2
  • $\begingroup$ With kglr's solution: ir = ImplicitRegion[Sin[u] <= Cos[v] && Sin[v] <= Cos[w] && Sin[w] <= Cos[u],{{u, 0, 4 Pi}, {v, 0, 4 Pi}, {w, 0, 4 Pi}}]; try Volume@DiscretizeRegion@ir $\endgroup$
    – rmw
    Commented Aug 5, 2019 at 13:15
  • $\begingroup$ @rmw Thank you! $\endgroup$
    – Klangen
    Commented Aug 5, 2019 at 14:25

2 Answers 2

3
$\begingroup$

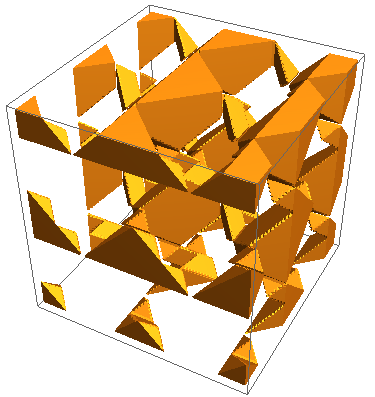
You can try RegionPlot3D:

RegionPlot3D[Sin[u] <= Cos[v] && Sin[v] <= Cos[w] && Sin[w] <= Cos[u],
   {u, 0, 4 Pi}, {v, 0, 4 Pi}, {w, 0, 4 Pi}, PlotPoints -> 90]

enter image description here

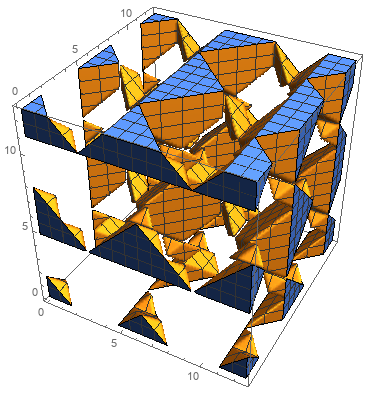
Or use ImplicitRegion:

ir = ImplicitRegion[Sin[u] <= Cos[v] && Sin[v] <= Cos[w] && Sin[w] <= Cos[u],
     {{u, 0, 4 Pi}, {v, 0, 4 Pi}, {w, 0, 4 Pi}}];

RegionPlot3D[ir, PlotPoints -> 100]

enter image description here

$\endgroup$
2
  • $\begingroup$ Thank you. Is there a way to compute its volume numerically? $\endgroup$
    – Klangen
    Commented Aug 5, 2019 at 13:59
  • 1
    $\begingroup$ @Klangen, try RegionMeasure@ir or Volume@ir . $\endgroup$
    – kglr
    Commented Aug 5, 2019 at 16:38
3
$\begingroup$

I question the accuracy of the volume calculated by DiscretizeRegion: Just excise one out of the bunch to get the plot:
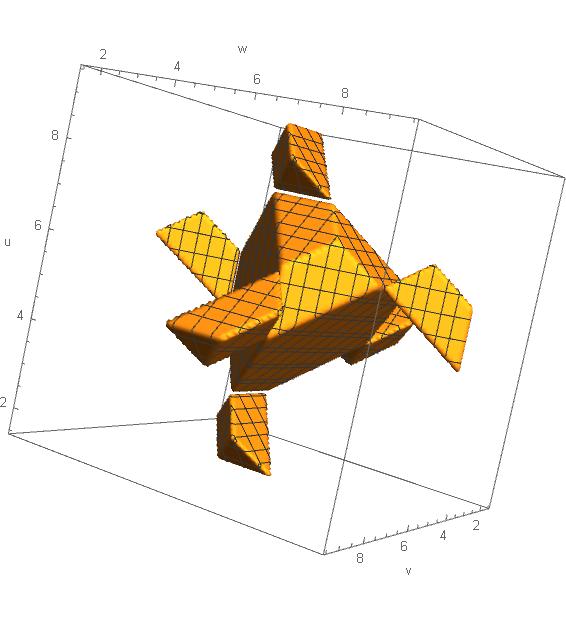
enter image description here

First compute the volume via DiscretizeRegion:

ir = ImplicitRegion[
  Sin[u] <= Cos[v] && Sin[v] <= Cos[w] && 
   Sin[w] <= Cos[u], {{u, Pi/2, 3 Pi}, {v, Pi/2, 3 Pi}, {w, Pi/2, 
    3 Pi}}]; Volume@DiscretizeRegion@ir

Results: 32.54

Now do a Monte-Carlo integration series from 5000 to 1000000 points:

myTable = Table[
   myPts = RandomReal[{Pi/2, 3 Pi}, {num, 3}];
   pts = Length@
     Select[myPts, (Sin[#[[1]]] <= Cos[#[[2]]] && 
         Sin[#[[2]]] <= Cos[#[[3]]] && Sin[#[[3]]] <= Cos[#[[1]]]) &];
   pts/num (5 Pi/2)^3 // N, {num, 5000, 1000000, 5000}];

and plot the results and do a Fit of the data:
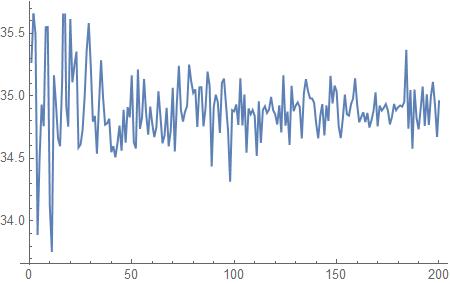
enter image description here

Fit[myTable, {1, x}, x]

34.9067 -0.000148992 x

which appears to be settling on a value significantly higher than 32.5 computed by DiscretizeRegion.

$\endgroup$
2
  • 1
    $\begingroup$ It appears a smaller MaxCellMeasure, say 0.001, is needed for DiscretizeRegion (or BoundaryDiscretizeRegion) to get a accuracy result. $\endgroup$
    – Silvia
    Commented Aug 6, 2019 at 14:55
  • $\begingroup$ Thanks, didn't know about MaxCellMeasure. I got 34.86 with MaxCellMeasure->0.0001. $\endgroup$
    – Dominic
    Commented Aug 6, 2019 at 16:49

Your Answer

By clicking “Post Your Answer”, you agree to our terms of service and acknowledge you have read our privacy policy.

Not the answer you're looking for? Browse other questions tagged or ask your own question.