3
$\begingroup$

Basically, I wanted to vary a parameter in my differential equations, while using NDsolve (ParametricNDsolve wasn't working for some reason, but that's for another question). I'm stuck looking for the correct command for the last part in the following code section (Very sorry for the crappy formatting).

For[e = 0, e < 6, e++, {Sol = NDSolve[{H[t] == -e*g[t], g[0] == g[2*Pi],

g[Pi] == 1}, g[t], {t, 0, 2*Pi}]}; <Command to insert g[t]/.Sol in a Table>] My intention is to then plot all the solutions hence stored in the Table, using another loop, in a single graph. If this can be done directly, please provide some hints how.

$\endgroup$
2
  • $\begingroup$ use Sol ={}; For[.e ==0, .., AppendTo[Sol,NDSolve[....]]? $\endgroup$
    – kglr
    Commented Jun 13, 2019 at 19:00
  • 1
    $\begingroup$ You should take a look at ParametricNDSolve. That will make your life much easier. Also: forget For exists in Mathematica. Use Table or Do instead. $\endgroup$ Commented Jun 13, 2019 at 19:12

1 Answer 1

5
$\begingroup$

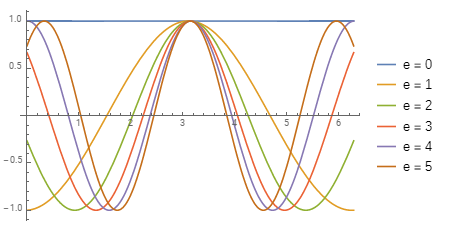
In your code, Sol is replaced by the new solution in every iteration. If you have to use For, you can initialize sol to {} in the first argument of For and use AppendTo to append new solutions (below, I used g''[t] for your H[t]):

For[sol = {}; e = 0, e < 6, e++, 
    AppendTo[sol, 
      First@NDSolve[{g''[t] == -e*g[t], g[0] == g[2*Pi], g[Pi] == 1}, 
          g[t], {t, 0, 2*Pi}]]];
Plot[Evaluate[Flatten[g[t] /. sol]], {t, 0, 2 Pi}, 
  PlotLegends -> ("e = " <> ToString[#] & /@ Range[0, 5])]

enter image description here

Alternatively, you can use Table:

sol2 = Table[First@NDSolve[{g''[t] == -e*g[t], g[0] == g[2*Pi], g[Pi] == 1}, 
          g[t], {t, 0, 2*Pi}], {e, 0, 5}];
Plot[Evaluate[Flatten[g[t] /. sol2]], {t, 0, 2 Pi}, 
  PlotLegends -> ("e = " <> ToString[#] & /@ Range[0, 5])]

same picture

A much better approach is to create a parametric solution using ParametricNDSolve or ParametricNDSolveValue (as suggested by Sjoerd in the comments):

pndsv = ParametricNDSolveValue[{g''[t] == -a*g[t], g[0] == g[2*Pi], g[Pi] == 1}, 
    g, {t, 0, 2*Pi}, {a}];
Plot[Evaluate[Table[pndsv[a][t], {a, 0, 5, 1}]], {t, 0, 2 Pi},
 PlotRange -> All,  PlotLegends -> ("e = " <> ToString[#] & /@ Range[0, 5])]

same picture

$\endgroup$

Your Answer

By clicking “Post Your Answer”, you agree to our terms of service and acknowledge you have read our privacy policy.

Not the answer you're looking for? Browse other questions tagged or ask your own question.