5
$\begingroup$

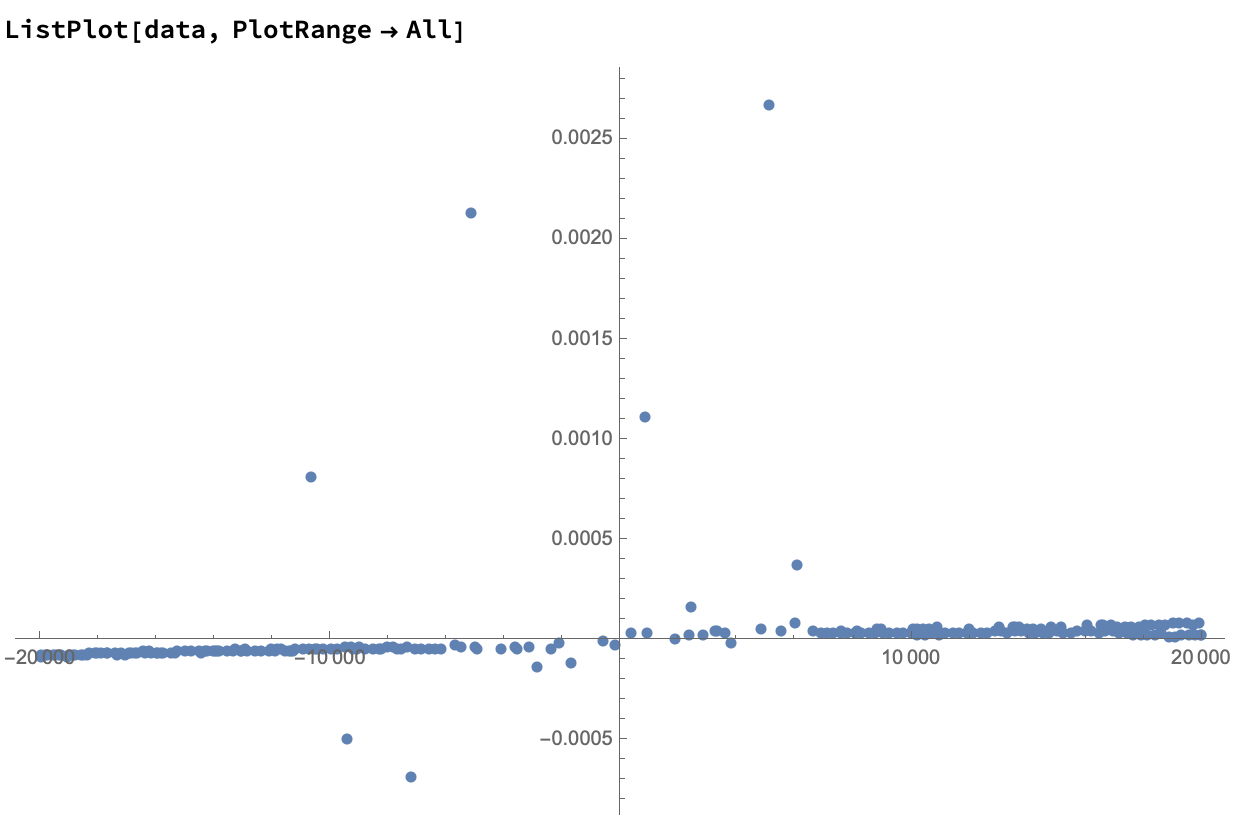
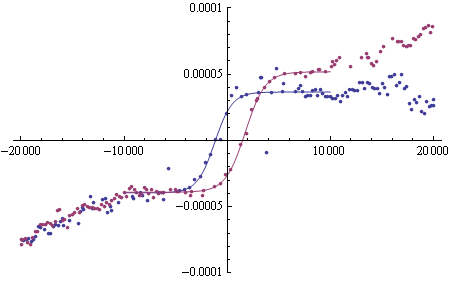
I have experimental data which looks something like this enter image description here
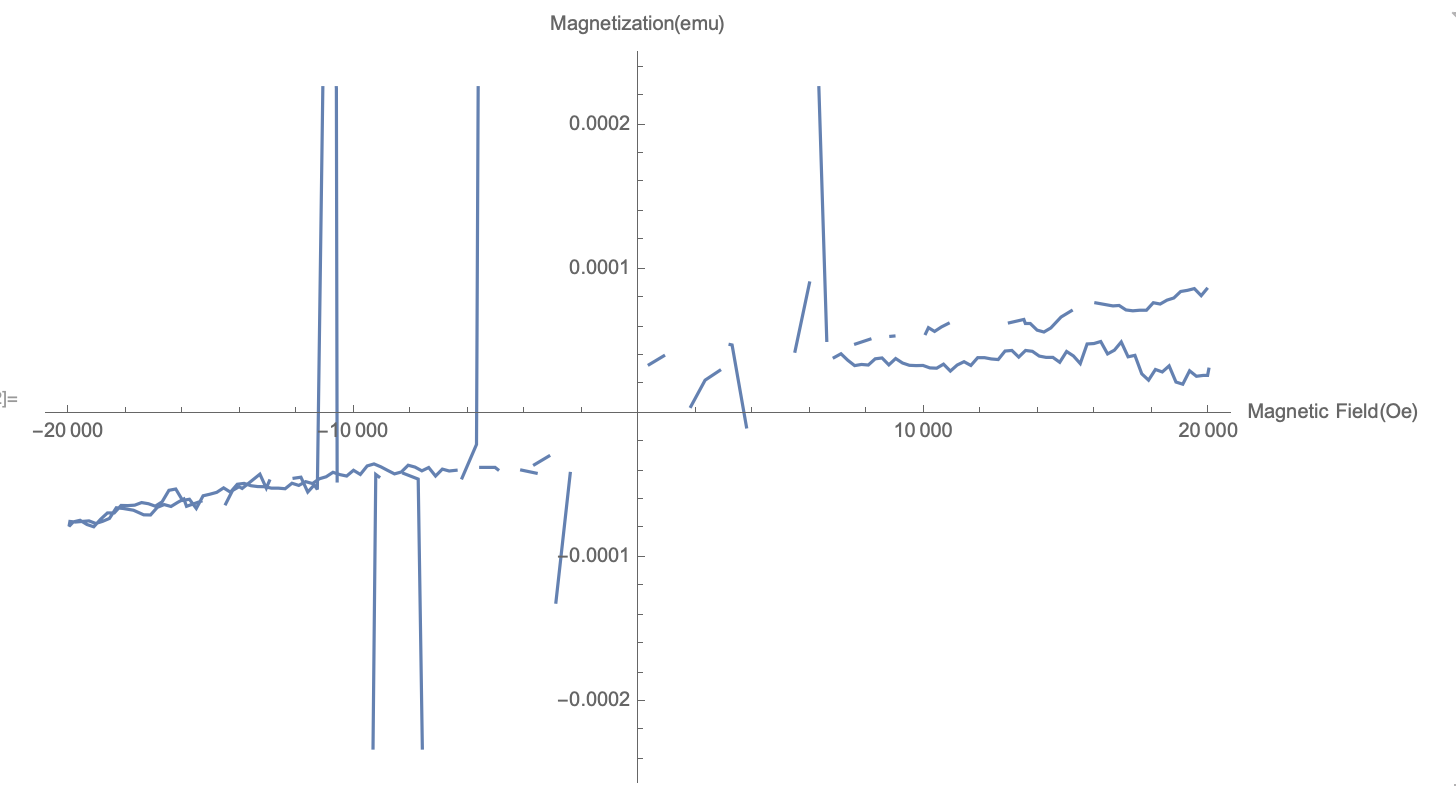
I first want to remove the outlier points which are at quite high value such as around x= -10,000 etc, how to automatically trim these points.

Then around x=0, I have missing data points and I want to extrapolate the existing curve to get a new version. How should I do it?

If anyone is interested here is my data:

Magneticfield = {19999.5, 19958.5, 19804.9, 19567., 19327.5, 19088.7, 18849.6, \
18609.8, 18370.3, 18129.3, 17888.9, 17650., 17410.4, 17170.6, \
16930.9, 16691.3, 16451.7, 16211.9, 15973., 15734., 15494., 15254.1, \
15014.6, 14774.4, 14534.1, 14294.4, 14055.5, 13815.7, 13575.9, \
13336.9, 13096.7, 12856.8, 12617.1, 12377.2, 12137.3, 11897.6, \
11658., 11418.5, 11179., 10939.4, 10699.4, 10459.7, 10220.1, 9980.23, \
9741.27, 9502.3, 9261.83, 9021.18, 8782.03, 8543.24, 8303.09, \
8062.75, 7822.94, 7582.47, 7342.6, 7104.21, 6865.2, 6626.64, 5999.22, \
5493.19, 5398.44, 4798.75, 4292.4, 3789.79, 3284.89, 3215.92, \
3027.13, 2410.08, 1895.67, 1391.51, 885.82, 379.671, -115.872, \
-623.505, -1125.88, -1634.51, -2137.94, -2639.87, -3141.62, -3642.53, \
-4153.16, -4658.18, -5166.93, -5676.18, -6181.8, -6192.78, -6709.73, \
-7219.03, -7722.2, -8228.04, -8412.4, -9101.69, -9208.82, -9436.59, \
-10058.5, -10562.5, -10657.5, -11257.4, -11365.9, -11593.3, -11832.9, \
-12072.6, -12309.9, -12939.8, -13046.3, -13271.3, -13893.5, -14002.1, \
-14230.1, -14469.8, -14709.9, -15339.3, -15844., -15937., -16148.2, \
-16387.8, -16627.7, -16867.4, -17106.3, -17345.6, -17705.2, -18065.2, \
-18306.4, -18546.3, -18785.1, -19025., -19264.9, -19504.7, -19744.8, \
-19932.6, -19963.2, -19813.5, -19576.4, -19336.8, -19097.2, -18857.5, \
-18617.9, -18379., -18138.8, -17898.7, -17659.8, -17419.9, -17180.1, \
-16940.3, -16700.5, -16461., -16221.3, -15982.3, -15742.4, -15501.9, \
-15263., -15024.1, -14783.9, -14543.7, -14304., -14064.1, -13824.3, \
-13585.3, -13346.6, -13106.6, -12866.2, -12626.5, -12386.7, -12146.9, \
-11907.1, -11667.1, -11426.8, -11186.9, -10947.4, -10708.3, -10469.1, \
-10228.7, -9989.11, -9750.04, -9510.35, -9270.66, -9030.64, -8790.87, \
-8552.03, -8312.43, -8072.06, -7831.46, -7591.77, -7352.59, -7112.63, \
-6873.59, -6634.13, -6393.24, -6154.2, -5527.38, -5026., -4929.63, \
-4713.55, -4091.62, -3585.43, -3493.45, -2891.49, -2390.03, -2292.88, \
-1693.41, -1188.46, -682.805, -179.91, 319.04, 823.518, 1328.78, \
1839.95, 2339.51, 2849.49, 2963.87, 3578.31, 4082.59, 4586.96, \
5092.08, 5597.75, 6089.97, 6605.45, 7109.6, 7616.6, 8118.46, 8228.8, \
8851.97, 8960.51, 9565.92, 10072.3, 10170.3, 10385.8, 10624.7, \
10864.6, 11491.5, 11997.1, 12505.6, 13009.7, 13515.9, 13569., \
13740.6, 13980.5, 14220.3, 14460.9, 14821., 15180.2, 15420.2, \
16040.6, 16547.8, 16642.7, 16857., 17096.8, 17336.6, 17575.8, \
17814.8, 18055.7, 18296., 18535.2, 18774.9, 19014.7, 19254.5, \
19494.2, 19734.2, 19926.9};

Magnetization = {0.0000308, 0.0000265, 0.0000265, 0.0000259, 0.0000297, 0.0000204, \
0.0000219, 0.0000331, 0.0000289, 0.0000306, 0.0000232, 0.0000276, \
0.0000404, 0.0000394, 0.0000497, 0.000044, 0.0000414, 0.00005, \
0.0000486, 0.0000483, 0.0000347, 0.00004, 0.0000431, 0.0000356, \
0.000039, 0.000039, 0.0000399, 0.0000432, 0.0000438, 0.0000392, \
0.0000438, 0.0000434, 0.0000375, 0.0000379, 0.0000388, 0.0000388, \
0.0000334, 0.000036, 0.0000337, 0.0000295, 0.0000343, 0.0000315, \
0.0000317, 0.0000334, 0.0000333, 0.0000335, 0.0000351, 0.0000382, \
0.0000338, 0.0000386, 0.000038, 0.0000337, 0.0000341, 0.0000333, \
0.000037, 0.0000415, 0.0000389, "", 0.0000906, 0.0000433, "", \
0.0000543, "", -9.22*10^-6, 0.0000476, 0.0000479, "", 0.0001704, "", \
"", 0.00004, 0.000034, "", 
 4.71*10^-7, "", "", -0.0000169, "", -0.0000295, -0.0000354, "", "", \
0.00213533, -0.0000214, -0.0000446, "", "", -0.000685166, -0.0000454, \
-0.0000415, "", -0.0000438, -0.0000422, -0.000492149, "", -0.0000467, \
0.00081401, -0.0000526, -0.0000495, -0.0000544, -0.0000441, \
-0.0000448, "", -0.0000467, -0.0000517, -0.000042, -0.0000519, \
-0.0000507, -0.0000533, -0.0000626, "", -0.0000608, -0.0000643, \
-0.0000592, -0.0000615, -0.0000644, -0.0000631, -0.000065, \
-0.0000703, -0.0000702, -0.000067, -0.0000658, -0.0000653, \
-0.0000727, -0.0000747, -0.0000762, -0.0000744, -0.0000748, \
-0.0000752, -0.0000748, -0.0000782, -0.0000751, -0.000074, \
-0.0000769, -0.0000785, -0.0000733, -0.0000689, -0.0000689, \
-0.0000637, -0.0000638, -0.0000635, -0.0000617, -0.0000625, \
-0.0000642, -0.0000612, -0.0000532, -0.0000523, -0.0000602, \
-0.0000594, -0.0000658, -0.000057, -0.0000559, -0.0000546, \
-0.0000515, -0.0000545, -0.000049, -0.0000484, -0.00005, -0.0000506, \
-0.0000507, -0.0000517, -0.0000517, -0.0000521, -0.0000483, \
-0.0000498, -0.0000472, -0.0000485, -0.0000452, -0.0000438, \
-0.0000407, -0.0000423, -0.0000433, -0.0000393, -0.0000422, \
-0.0000363, -0.0000349, -0.0000369, -0.0000394, -0.0000418, \
-0.0000405, -0.0000358, -0.0000371, -0.0000397, -0.0000374, \
-0.0000433, -0.0000385, -0.0000398, -0.0000393, "", -0.0000373, \
-0.0000373, -0.0000388, "", -0.0000392, -0.0000413, "", -0.000130764, \
-0.0000415, "", -0.000111659, "", "", -0.0000255, "", 0.00111743, "", 
 4.96*10^-6, 0.0000232, 0.0000299, "", 0.00004, "", "", 0.00267187, \
"", 0.000377004, 0.0000508, "", 0.0000483, 0.0000516, "", 0.0000536, \
0.0000538, "", 0.0000555, 0.0000596, 0.000057, 0.0000601, 0.0000625, \
"", 0.0000562, "", 0.000063, 0.0000653, 0.0000625, 0.0000625, \
0.0000579, 0.0000566, 0.0000594, 0.000067, 0.0000713, "", 0.0000768, \
0.000075, 0.0000747, 0.000075, 0.0000719, 0.0000713, 0.0000717, \
0.0000717, 0.0000769, 0.000076, 0.0000787, 0.0000802, 0.0000847, \
0.0000855, 0.0000867, 0.0000818, 0.0000864}

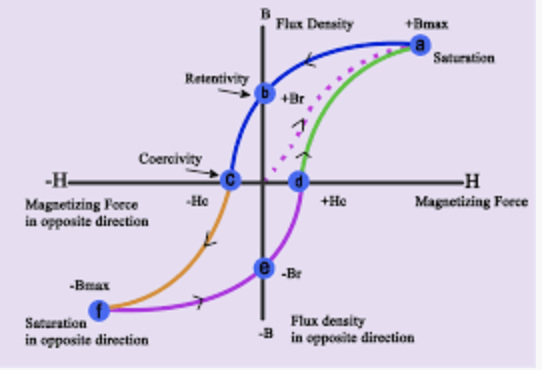
Final plot should be hysteresis like this: enter image description here

$\endgroup$
3
  • $\begingroup$ You can format inline code and code blocks by selecting the code and clicking the {} button above the edit window. The edit window help button ? is useful for learning how to format your questions and answers. You may also find this meta Q&A helpful $\endgroup$
    – Michael E2
    Commented May 21, 2019 at 2:54
  • $\begingroup$ Why does Magnetization have a bunch of values that are ""? Quotation marks indicate strings, and strings cannot be plotted. $\endgroup$
    – MassDefect
    Commented May 21, 2019 at 5:12
  • $\begingroup$ How were the hysteresis loops measured? I would hesitate to remove outliers to fit a new curve in without knowing more about the methods used and the errors involved, as the outliers may very well be 'real' information, and the hysteresis loops may be real. Hysteresis loops, whilst can be naively described as a Sigmoid function, can be more complicated than that: physics.stackexchange.com/questions/60194/… or ieeexplore.ieee.org/document/7133863 $\endgroup$
    – Letshin
    Commented Jun 7, 2019 at 11:09

3 Answers 3

5
$\begingroup$

We can do the first part rather easily using FindAnomalies or DeleteAnomalies, and the second can be attempted using SynthesizeMissingValues. All these functions are new in version 12.

First, let's remind ourselves of your initial data.

enter image description here

We do a first run of DeleteAnomalies using a high AcceptanceThreshold, in order to remove the really blatant outliers. I also replace "" with Missing[], as it seems that's what's intended, and "" will cause the automatic anomaly detection to work less well, since the data is not all numeric.

data = data /. "" -> Missing[]

data2 = DeleteAnomalies[data, AcceptanceThreshold -> .2]

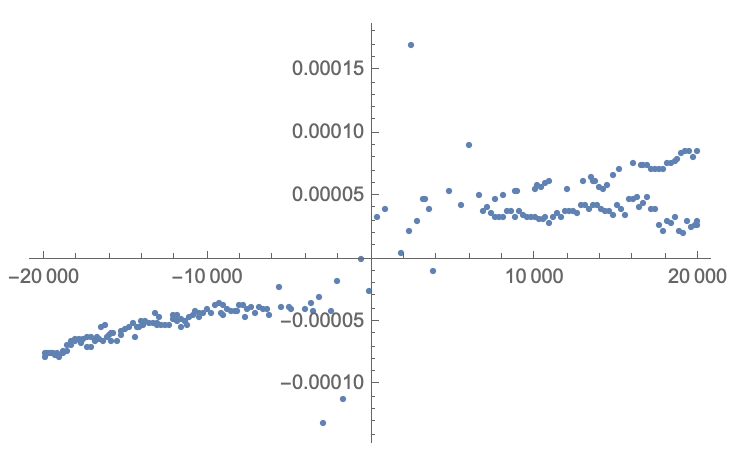
Now we are left with "smaller" anomalies:

ListPlot[data2, PlotRange->All]

enter image description here

We can now run DeleteAnomalies again, with a lower AcceptanceThreshold (in this case the default of 0.001), to get the more "local" anomalies:

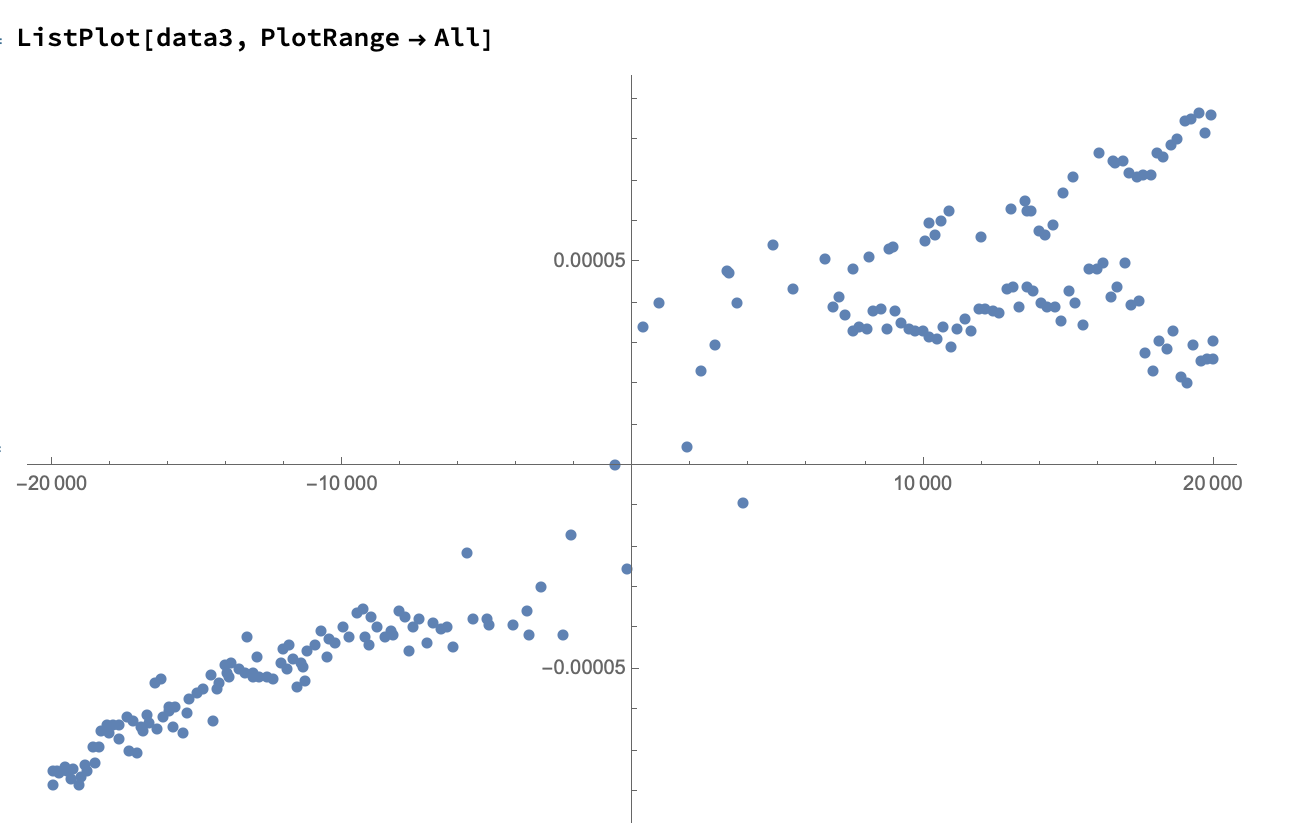
data3 = DeleteAnomalies[data2];

And now we are left with what looks like very clean data:

enter image description here

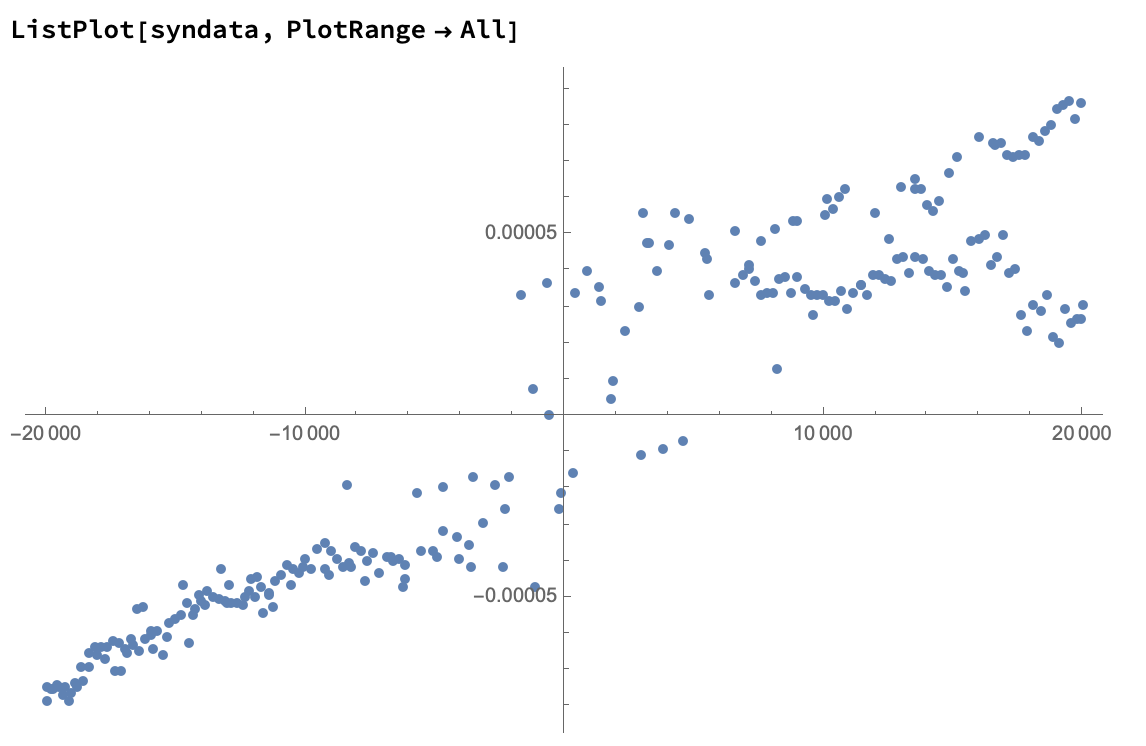
Now, let's see how SynthesizeMissingValues will do on this data, to find your missing values. (Remember that we replaced "" with Missing[] above - this is required)

syndata = SynthesizeMissingValues[data3, PerformanceGoal -> "Quality", TimeGoal -> Quantity[60, "Seconds"]]

And now let's have a look at the outcome:

ListPlot[syndata, PlotRange->All]

enter image description here

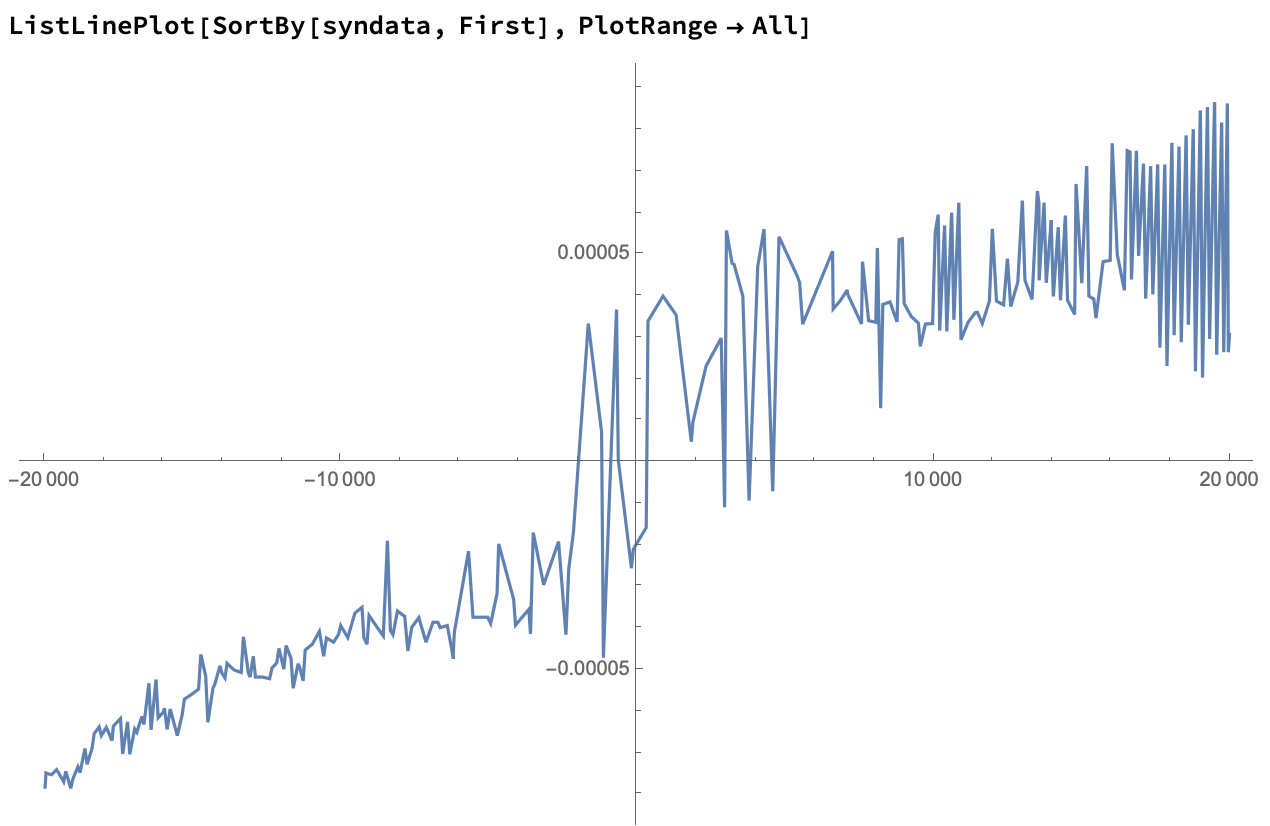
Let's sort the points and plot them on a line:

enter image description here

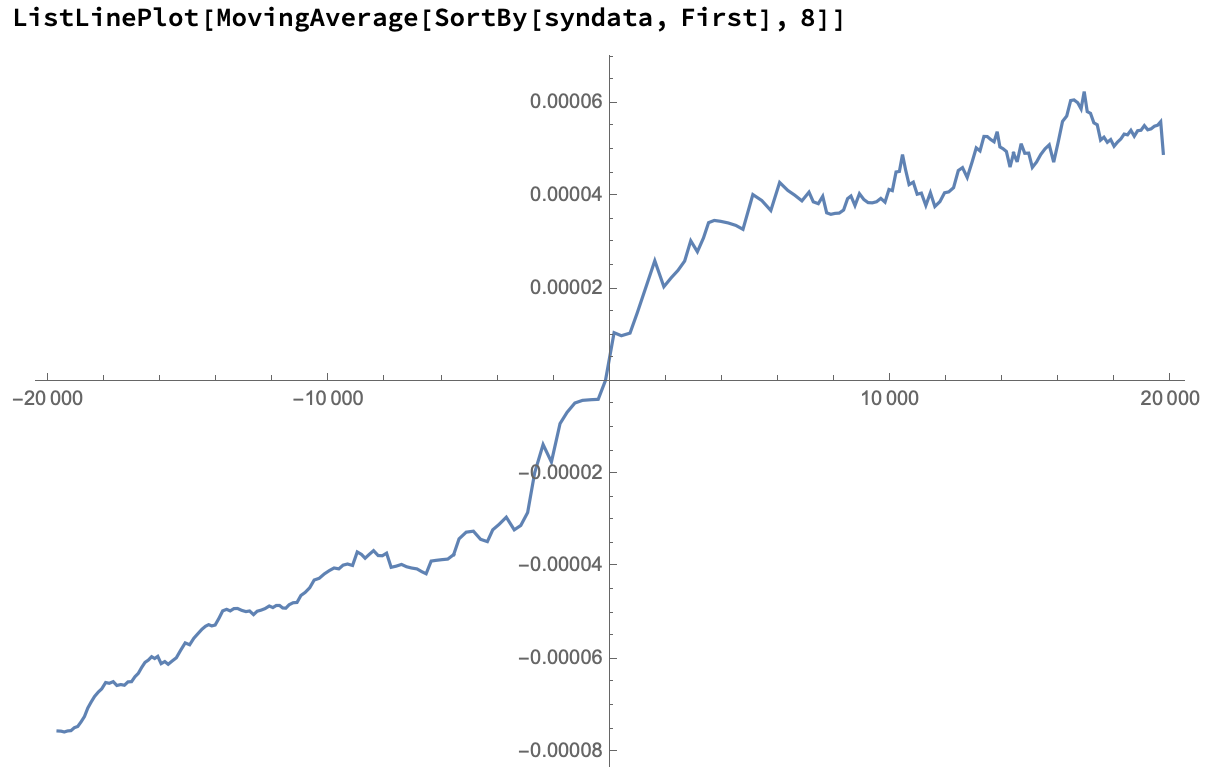
We can approximate results by taking a moving average of these points:

enter image description here

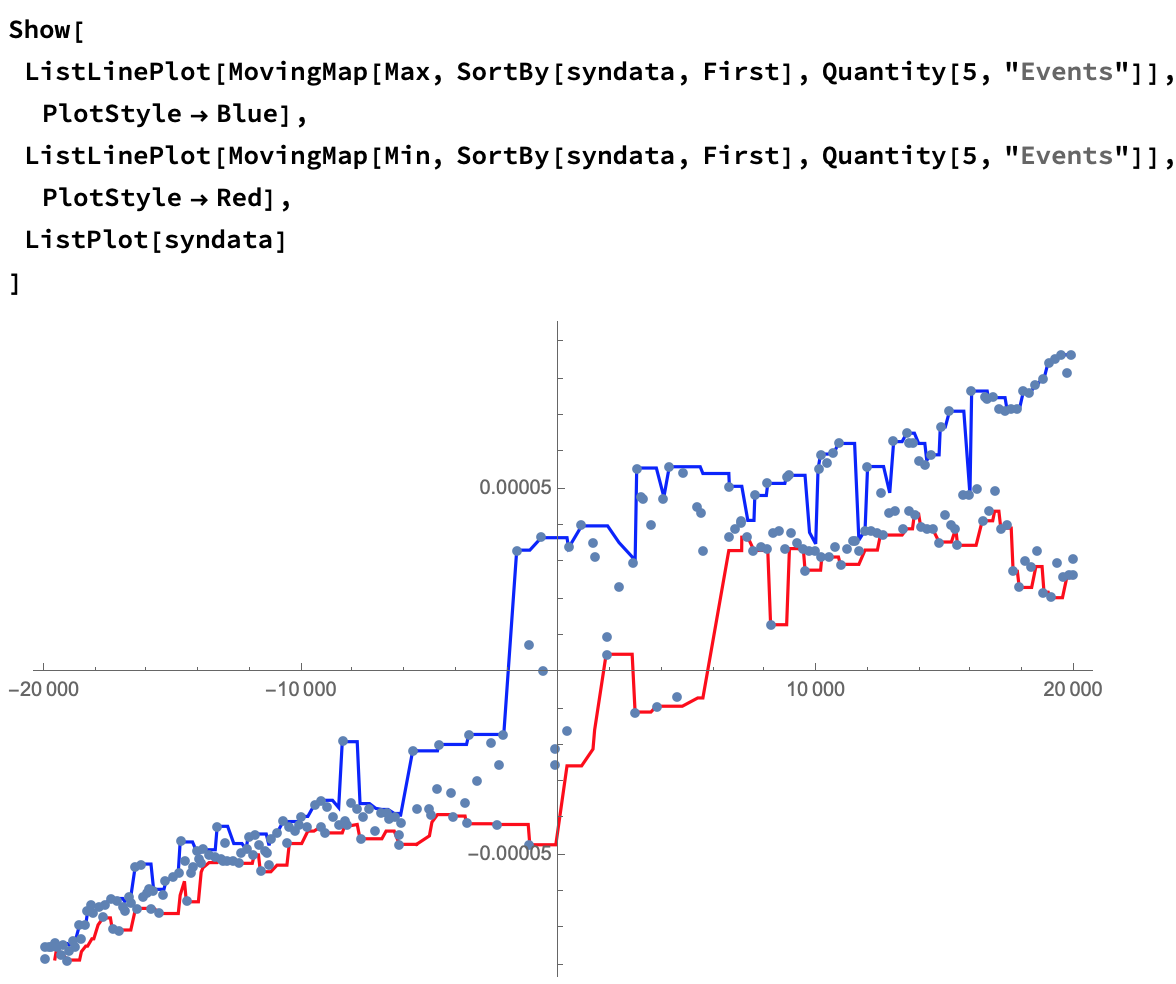
Since you're looking for a hysteresis, we can approximate that using a moving Min and Max:

Show[
 ListLinePlot[
  MovingMap[Max, SortBy[syndata, First], Quantity[5, "Events"]], 
  PlotStyle -> Blue],
 ListLinePlot[
  MovingMap[Min, SortBy[syndata, First], Quantity[5, "Events"]], 
  PlotStyle -> Red],
 ListPlot[syndata]
 ]

enter image description here

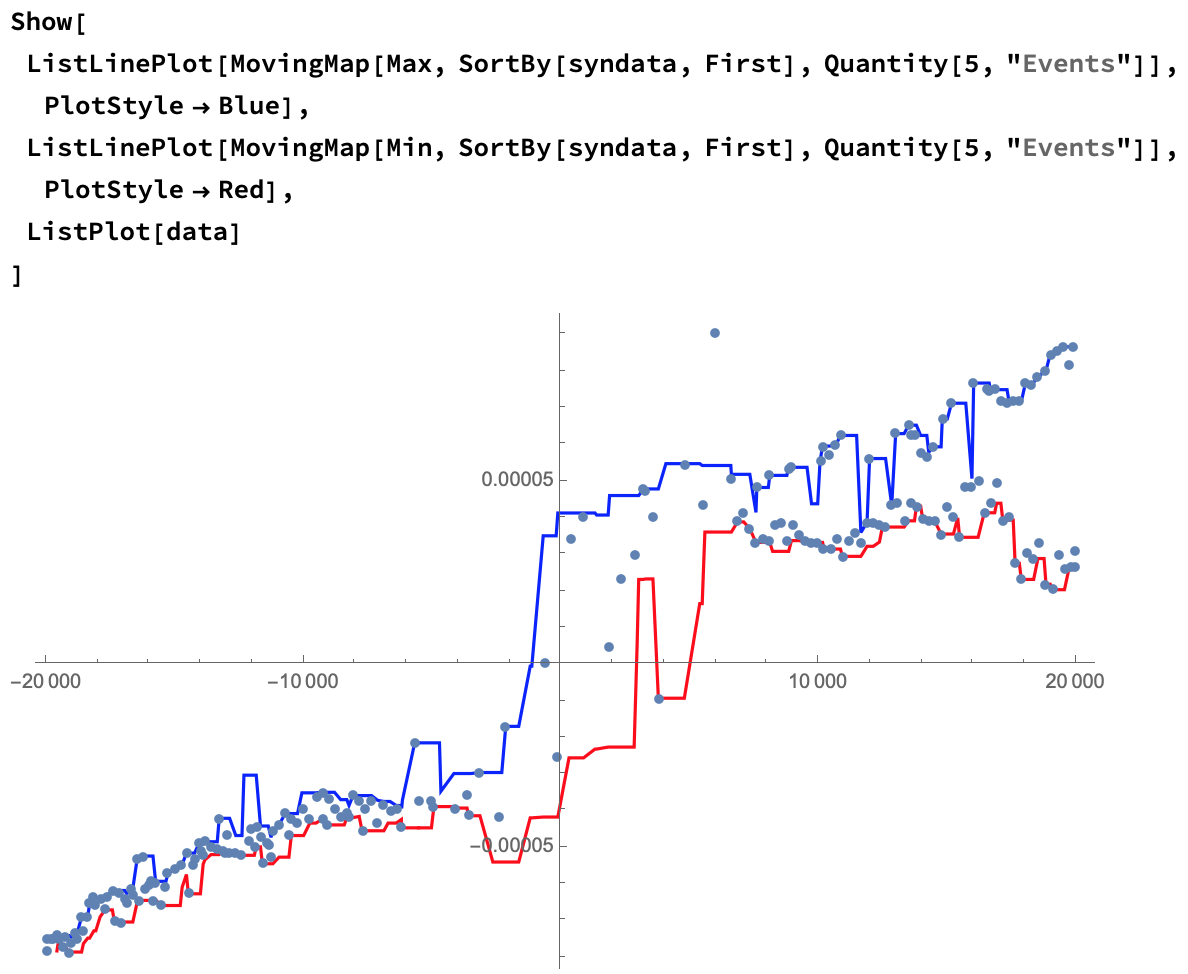
And to show only your initial data:

enter image description here

Some things to consider:

  • FindAnomalies, DeleteAnomalies, and SynthesizeMissingValues all use approximation methods, and may give different results every time you run them.
  • Consider varying the windows for MovingMap.
$\endgroup$
5
  • 2
    $\begingroup$ Would it be better to use SynthesizeMissingValues separately on the two halves of the data, to maintain the hysteresis? In the original unsorted data, it appears that the first half is the "top" of the loop and the second half is the "bottom". $\endgroup$
    – MelaGo
    Commented May 21, 2019 at 22:08
  • $\begingroup$ That sounds like a great idea @MelaGo! I would encourage you to try it out. There's certainly a lot of room for experimentation here. $\endgroup$
    – Carl Lange
    Commented May 21, 2019 at 22:11
  • $\begingroup$ My version of MMA doesn't support SynthesizeMissingValues, but I updated my answer with an attempt using curve fitting. $\endgroup$
    – MelaGo
    Commented May 21, 2019 at 23:48
  • $\begingroup$ @MelaGo Looks really great, well done! $\endgroup$
    – Carl Lange
    Commented May 21, 2019 at 23:51
  • $\begingroup$ Thanks! Not sure it's a good idea to construct data that way though... $\endgroup$
    – MelaGo
    Commented May 21, 2019 at 23:57
5
$\begingroup$

First, removing outliers:

Make {x,y} pairs and remove points with missing y-values:

data = Transpose[{Magneticfield, Magnetization}];
data2 = DeleteCases[data, {_, ""}];
ListPlot[data2, PlotRange -> All]

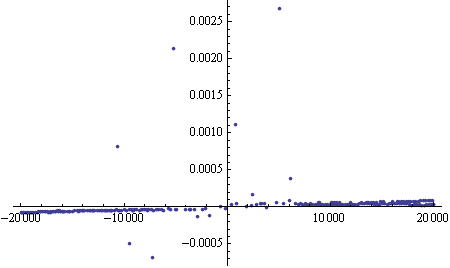
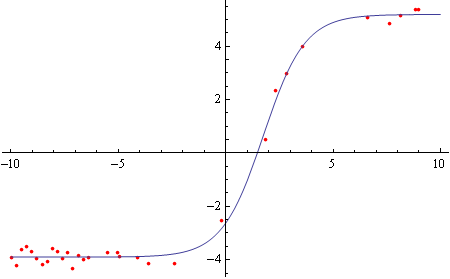
enter image description here

In this case, the outliers are so far off that most of them can be removed with simple min-max thresholds.

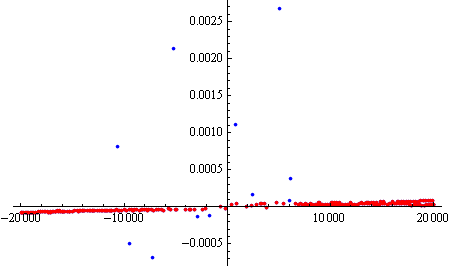
dataculled = Select[data2, #[[2]] > -0.0001 && #[[2]] < 0.00009 &];
ListPlot[{data2, dataculled}, PlotStyle -> {Blue, Red}, PlotRange -> All]

enter image description here

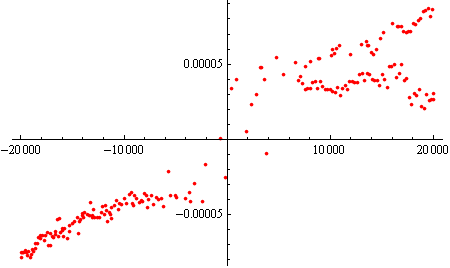
And now if you zoom in a bit, it does actually resemble a hysteresis loop.

ListPlot[dataculled, PlotStyle -> Red, PlotRange -> All]

enter image description here

Updated to add something about guessing missing values, with the caveat that adding data points this way may not be appropriate or ethical, depending on your experiment.

Unfortunately my old version of MMA doesn't support SynthesizeMissingValues. Instead, I attempted manual fitting using a sigmoidal curve:

model = bottom + (top - bottom)/(1 + 10^((h50 - x) hs));

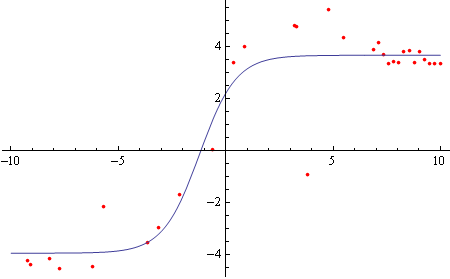
First looking at the "top" part of the hysteresis loop, and restricting data to domain [-10000,10000]:

tophalf = Select[dataculled[[;; Round[Length[dataculled]/2]]], 10000 > #[[1]] > -10000 &];
topfit = FindFit[{.001, 100000} # & /@ tophalf, model, {bottom, top, h50, hs}, x]
Show[
  ListPlot[{.001, 100000} # & /@ tophalf, PlotStyle -> Red, PlotRange -> All],    
  Plot[model /. topfit, {x, -10, 10}]]
(* For a reason I don't exactly understand, I was unable to fit using the raw data, so I transformed {x,y} by {0.001,100000}. *)

enter image description here

Same for the "bottom" part of the loop:

bottomhalf = Select[dataculled[[Round[Length[dataculled]/2] ;;]], 10000 > #[[1]] > -10000 &];
bottomfit = FindFit[{.001, 100000} # & /@ bottomhalf, model, {bottom, top, h50, hs}, x]
Show[
  ListPlot[{.001, 100000} # & /@ bottomhalf, PlotStyle -> Red, PlotRange -> All], 
  Plot[model /. bottomfit, {x, -10, 10}]]

enter image description here

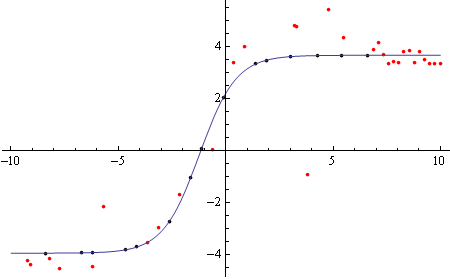
Now to calculate missing values based on the curve fits.

Finding x-values with missing y-values:

topmissing = Select[Cases[data[[;; Round[Length[data]/2]]], {_, ""}], 10000 > #[[1]] > -10000 &][[All, 1]];

Plugging those x-values into the model:

topsynth = Table[{m, (model /. topfit /. x -> 0.001 m)/100000}, {m,topmissing}];
Show[ListPlot[{{.001, 100000} # & /@ tophalf, {.001, 100000} # & /@ topsynth}, PlotStyle -> {Red, Black}, PlotRange -> All], 
 Plot[model /. topfit, {x, -10, 10}]]

enter image description here

And same for the bottom part:

bottommissing = Select[Cases[data[[Round[Length[data]/2] ;;]], {_, ""}], 10000 > #[[1]] > -10000 &][[All, 1]];
bottomsynth = Table[{m, (model /. bottomfit /. x -> 0.001 m)/100000}, {m, bottommissing}];
Show[ListPlot[{{.001, 100000} # & /@ bottomhalf, {.001, 100000} # & /@
     bottomsynth}, PlotStyle -> {Red, Black}, PlotRange -> All], 
 Plot[model /. bottomfit, {x, -10, 10}]]

enter image description here

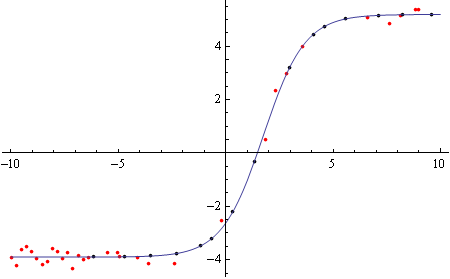
Finally merging the old and new values:

fulltop = Join[dataculled[[;; Round[Length[dataculled]/2]]], topsynth];
fullbottom = Join[dataculled[[Round[Length[dataculled]/2] ;;]], bottomsynth];
Show[
 ListPlot[{fulltop, fullbottom}, PlotRange -> {-0.0001, 0.0001}],
 Plot[{(model /. topfit /. x -> 0.001 xx)/100000, (model /. bottomfit /. x -> 0.001 xx)/100000}, {xx, -10000, 10000}]]

enter image description here

$\endgroup$
4
$\begingroup$

I like the approach taken in Carl Lange's answer -- built-in functions are used.

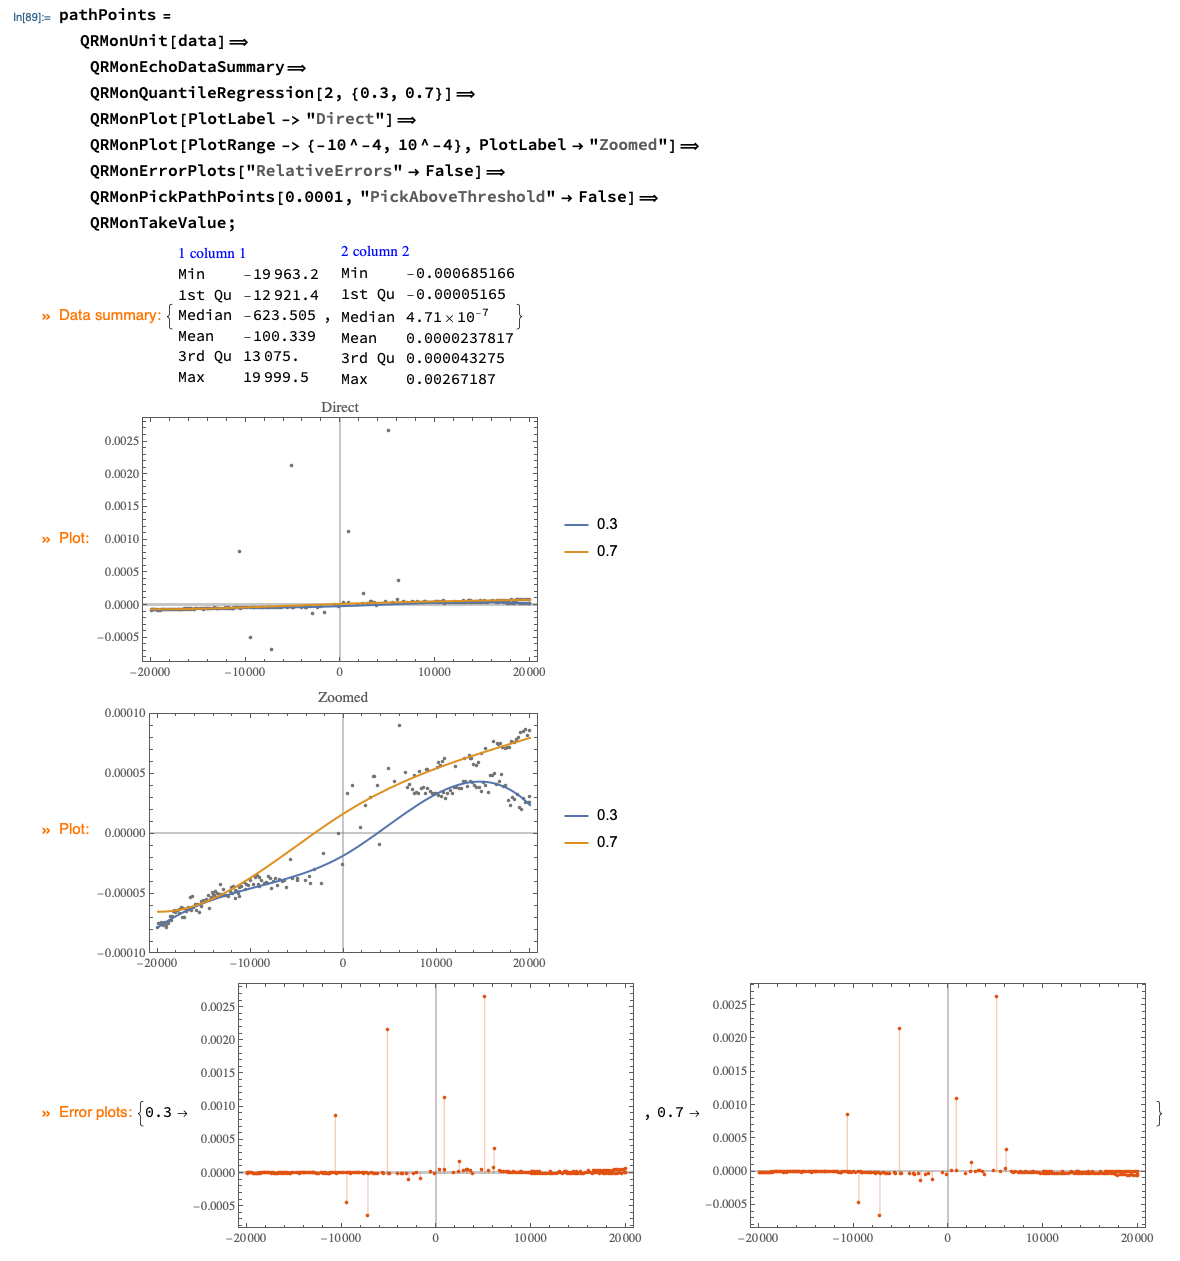
That said, in previous answers, like this one, there is a clear streamlined workflow using the software monad QRMon.

  1. Summarize the data.

  2. Do a Quantile Regression (QR) fit.

    • Using appropriate QR parameters and two probability values.
  3. Pick points close to the fitted curves.

    • Using an appropriate threshold.

    • The absolute error plots can help with selecting the threshold.

  4. Plot the picked points.

  5. If the results are not satisfactory go to 2.

  6. The outliers are removed at this point -- they were not picked.

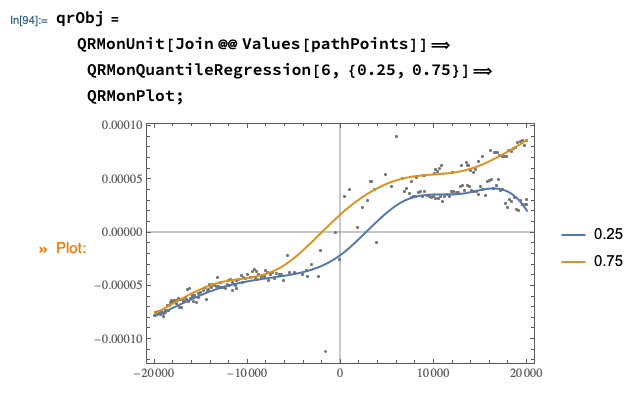
  7. Do a QR fit over the picked points and plot the fitted functions.

    • Using appropriate QR parameters and two probability values.
  8. If the results are not satisfactory goto 7.

  9. Get the regression functions and apply them over points of interest.

Code

(For the computation results see the output section below.)

data = Transpose[{Magneticfield, Magnetization}];
data = Select[data, VectorQ[#, NumericQ] &];


Import["https://raw.githubusercontent.com/antononcube/\
MathematicaForPrediction/master/MonadicProgramming/\
MonadicQuantileRegression.m"]

(* Steps 1-5 *)
pathPoints =
  QRMonUnit[data]⟹
   QRMonEchoDataSummary⟹
   QRMonQuantileRegression[2, {0.3, 0.7}]⟹
   QRMonPlot[PlotLabel -> "Direct"]⟹
   QRMonPlot[PlotRange -> {-10^-4, 10^-4}, PlotLabel -> "Zoomed"]⟹
   QRMonErrorPlots["RelativeErrors" -> False]⟹
   QRMonPickPathPoints[0.0001, "PickAboveThreshold" -> False]⟹
   QRMonTakeValue;

(* Steps 7 and 8 *)
qrObj =
  QRMonUnit[Join @@ Values[pathPoints]]⟹
   QRMonQuantileRegression[6, {0.25, 0.75}]⟹
   QRMonPlot;

(* Step 9 *)
qFuncs = qrObj⟹QRMonTakeRegressionFunctions;

Map[#[0] &, qFuncs]

(* <|0.25 -> -0.0000208432, 0.75 -> 0.0000174134|> *)

Output

Steps 1-5

enter image description here

Steps 7 and 8

enter image description here

$\endgroup$

Your Answer

By clicking “Post Your Answer”, you agree to our terms of service and acknowledge you have read our privacy policy.

Not the answer you're looking for? Browse other questions tagged or ask your own question.