1
$\begingroup$

How could i sample my data which follows distribution if i have only numerical values of density distribution as an example data attached as in picture

enter image description here

I tried but do not know how to do it.

The data:

0.02        0.1120516
0.04        0.1120319
0.06        0.1120267
0.08        0.1120309
0.1         0.1120353
0.12        0.1120393
0.14        0.1120433
0.16        0.1120475
0.18        0.1120521
0.2         0.1120571
0.22        0.1120627
0.24        0.1120691
0.26        0.1120762
0.28        0.1120844
0.3         0.1120937
0.32        0.1121041
0.34        0.1121158
0.36        0.112129
0.38        0.1121439
0.4         0.1121604
0.42        0.112179
0.44        0.1121995
0.46        0.1122223
0.48        0.1122474
0.5         0.1122752
0.52        0.1123057
0.54        0.112339
0.56        0.1123755
0.58        0.1124152
0.6         0.1124584
0.62        0.1125053
0.64        0.1125559
0.66        0.1126107
0.68        0.1126696
0.7         0.112733
0.72        0.112801
0.74        0.1128739
0.76        0.1129517
0.78        0.1130347
0.8         0.1131231
0.82        0.1132172
0.84        0.1133169
0.86        0.1134227
0.88        0.1135346
0.9         0.1136528
0.92        0.1137775
0.94        0.1139089
0.96        0.1140471
0.98        0.1141923
1           0.1143447

Link for data is attache it has 800 point. for preview 50 points are here link for data

$\endgroup$
8
  • $\begingroup$ What did you try, and how far did you get? Did you read the documentation for Import on how to import this data, for example, and did you read the documentation for ListPlot? $\endgroup$
    – C. E.
    Commented Nov 25, 2018 at 8:46
  • $\begingroup$ Import["C:\\distribution.txt", "Table"] $\endgroup$
    – Coolwater
    Commented Nov 25, 2018 at 8:52
  • $\begingroup$ I know how to import and Lisplot it. But i want to generate data which lies under this curve. I want to sample data. $\endgroup$
    – user43830
    Commented Nov 25, 2018 at 9:17
  • 2
    $\begingroup$ Have a look at EmpiricalDistribution. $\endgroup$ Commented Nov 25, 2018 at 10:10
  • 1
    $\begingroup$ You cannot perform such an excersise in a reliable way, especially with just 50 data points. The histogram can approximate a number of pdfs that differ in the parameters, functional type etc, and in addition your graph does not match your data in any way. You basically imply that rho(r) is a pdf (it is one only if it stays positive and integrates to 1, however) so depending on its form there are mathematical ways to sample from it. Even if you use EmpiricalDistribution or FindDistribution, or even through the histogram, you will probably get a wrong answer mathematically. $\endgroup$
    – Titus
    Commented Nov 25, 2018 at 10:15

2 Answers 2

2
$\begingroup$
data = Import["/Users/roberthanlon/Downloads/distribution.txt", 
    "Table"] /. {} -> Nothing;

{rmin, rmax} = MinMax[data[[All, 1]]]

(* {0.02, 16} *)

rho = Interpolation[data];

area = Integrate[rho[r], {r, rmin, rmax}]

(* 0.933619 *)

Since the area under rho is not 1, the distribution needs to be normalized.

dist = ProbabilityDistribution[rho[r], {r, rmin, rmax}, Method -> "Normalize"];

CDF[dist, rmax]

(* 1. *)

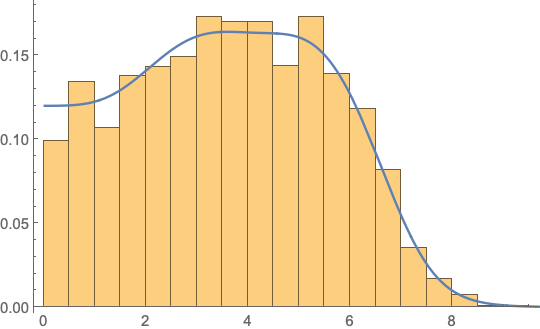
Sampling from the distribution

SeedRandom[0]

samples = RandomVariate[dist, 2000];

Show[
 Histogram[samples, Automatic, "PDF"],
 Plot[PDF[dist, r], {r, rmin, rmax}]]

enter image description here

$\endgroup$
7
  • 1
    $\begingroup$ I would just like to stress that the method samples from an approximate function produced from Interpolation. This tells us nothing about the true PDF of the data (e.g. the shape of the tails), however, so I would be very very cautious about interpretation and accuracy. It's "the best one can do". From a coding perspective, obviously this is an excellent answer. $\endgroup$
    – Titus
    Commented Nov 25, 2018 at 14:52
  • $\begingroup$ This CDF[dist, rmax] which gives result (* 1. *) is very slow it takes very long time. what is alternative for this ? It take hours for me. $\endgroup$
    – user43830
    Commented Nov 28, 2018 at 9:01
  • $\begingroup$ With version 11.3 on my MacBookPro CDF[dist, rmax] // AbsoluteTiming evaluates to {0.854351, 1.}, i.e., less than a second. Something else is probably causing the problem. Perhaps you need to start with a clean kernel or re-boot your system. Also, you don't need this since it is only used to demonstrate that the distribution is normalized and is not used elsewhere. $\endgroup$
    – Bob Hanlon
    Commented Nov 28, 2018 at 15:22
  • $\begingroup$ I am using version 10. and it take more then a day for me on windows 10 cpu i3 6100, 8gbram. It seems its not going to stop. i am still running from yesterday with absolute timing to see how long it will take. also in dist = ProbabilityDistribution[rho[r], {r, rmin, rmax}, Method -> "Normalize"] my word Method appears Red. @Bob Hanlon $\endgroup$
    – user43830
    Commented Nov 29, 2018 at 3:51
  • $\begingroup$ i want to do something like `R = 6.38; x = 2 * R * RandomReal[-1, 1]; y = 2 * R * RandomReal[-1, 1]; z = 2 * R * RandomReal[-1, 1]; rr = Sqrt[x^2 + y^2 + z^2];' and this rho[rr] has to be compared somehow with data/distribution rho[r] if rho[rr] less then rho[r] we accept all x,y,z and rho[rr] $\endgroup$
    – user43830
    Commented Nov 29, 2018 at 4:53
2
$\begingroup$

This is an extended comment that might very well be way off-base as my limited physics classes were taken almost half a century ago...

The data supplied appears to be that of the density of matter ($\rho(r)$ is a measure of mean number of particles per unit volume?) given the distance from the nucleus. Such curves are labeled as "distributions of density" but such distributions have NOTHING to do with probability distributions or probability density functions.

To normalize the area under the curve so that the area equals 1 does not justify the label of a probability distribution (or even an estimate of a probability distribution).

What you seem to have is a relationship between two variables and not a univariate or bivariate probability distribution from which samples can be taken. You have an estimate of mass density given distance.

Maybe another way to put this is that you have data that gives the value of mass density conditional on distance. Therefore there's no way to get samples of distance because the (probability) distribution of distance is unknown.

Again, my lack of knowledge of physics might likely be the source my confusion.

$\endgroup$
2
  • $\begingroup$ Yes Jim B you are right. this is what i want actually. $\endgroup$
    – user43830
    Commented Nov 27, 2018 at 9:53
  • $\begingroup$ Then I would suggest changing the wording in the question from "sample my data" to "predicting rho from r" (assuming that's really what you want). If you need those predictions (without any measure of precision), then what @BobHanlon gave prior to the normalization (i.e., just 'rho = Interpolation[data]`) would do just fine because there appears to be so little "error" from the smooth curve if you only need predictions within Mathematica code. If you need to predict using some other application, then we'd need to figure out a reasonable approximation. $\endgroup$
    – JimB
    Commented Nov 27, 2018 at 16:27

Your Answer

By clicking “Post Your Answer”, you agree to our terms of service and acknowledge you have read our privacy policy.

Not the answer you're looking for? Browse other questions tagged or ask your own question.