0
$\begingroup$

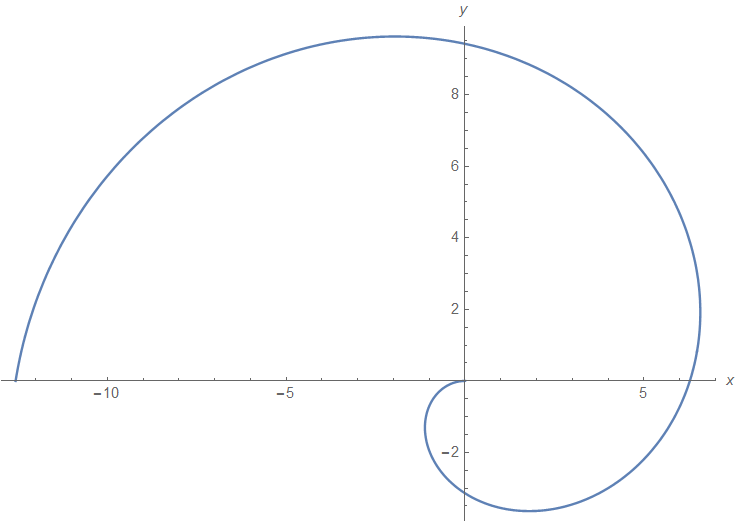
I tried to plot the function $r=-2t$ with $t$ in $[0,2\pi]$:

PolarPlot[-2 t, {t, 0, 2 Pi}, AxesLabel -> {x, y}]

enter image description here

When $t=\pi/4$, I have:

$$r=-\pi/2=-1.57$$

Through Get Coordinates, I saw the only point so that $r=-1.57$ is $("-"1.57, \,\, 3.9...)$. Why is the angle $3.9..=\pi+(\pi/4)$ different from $t=\pi/4$?

How can I get the above angle by using math formulas? I can't use the classic relationship $tan(t)=y/x$ because I don't know x and y (without looking the plot).

Thank you so much in advance.

$\endgroup$
9
  • $\begingroup$ That is your problem, the point you measured has r = 1.57. If you want to get an angle for r = -1.57 you need to reflect that point through the origin. $\endgroup$
    – Kuba
    Commented Nov 14, 2018 at 10:27
  • $\begingroup$ Hello @Kuba, can you explain your comment please? If the angle is unknown, how can I do the reflection? Maybe the angle is $\pi/4$? $\endgroup$ Commented Nov 14, 2018 at 10:30
  • $\begingroup$ I think the confusion here is what exactly does GetCoordinates give for PolarPlot $\endgroup$
    – Lotus
    Commented Nov 14, 2018 at 10:33
  • $\begingroup$ If you have a point (1,1) cartesian, is it (sqrt(2), Pi/4) or (-sqrt(2), 3Pi/4)? My point is that information that you use negative radius is gone so you have to think about it yourself. $\endgroup$
    – Kuba
    Commented Nov 14, 2018 at 10:36
  • $\begingroup$ @Kuba Ok, your example is clear. I have the inverse problem: given $r=-1.57$, what is the angle (without knowing x and y)? $\endgroup$ Commented Nov 14, 2018 at 10:42

1 Answer 1

5
$\begingroup$

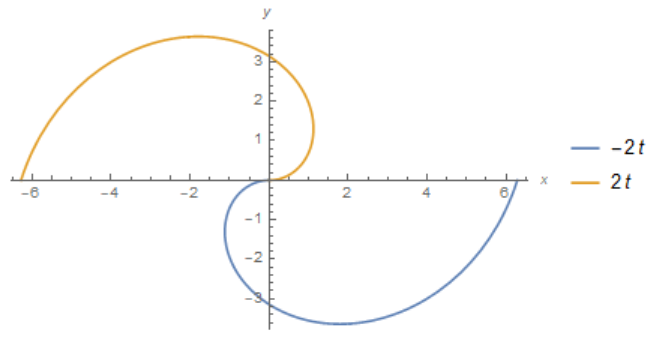
Here we have an example of incorrect use of the polar radius function r[t], which by definition must be positive or zero, $r\ge 0$. Mathematica offers a kind of solution for $r<0$ using the Euler formula $-1=e^{i\pi}$, and interpreting multiplication by $-1$ as a rotation of $\pi$. In this case,$\pi$ is added to the argument t. This is where the strange data comes from.

PolarPlot[{-2*t, 2*t} , {t, 0, Pi}, AxesLabel -> {x, y}, 
 PlotLegends -> "Expressions"]

enter image description here

$\endgroup$
2
  • $\begingroup$ Hello @AlexTrounev, thank you very much for your excellent explanation. $\endgroup$ Commented Nov 14, 2018 at 16:05
  • 1
    $\begingroup$ You're welcome! $\endgroup$ Commented Nov 14, 2018 at 16:22

Your Answer

By clicking “Post Your Answer”, you agree to our terms of service and acknowledge you have read our privacy policy.

Not the answer you're looking for? Browse other questions tagged or ask your own question.