The following code is exactly copied from the documentation on Predict using Gaussian Process.
data = {-1.2 -> 1.2, 1.4 -> 1.4, 3.1 -> 1.8, 4.5 -> 1.6};
p = Predict[data, Method -> "GaussianProcess"]

Show[Plot[{
     p[x],
     p[x] + StandardDeviation[p[x, "Distribution"]],
     p[x] - StandardDeviation[p[x, "Distribution"]]
    }, {x, -2, 6}, PlotStyle -> {Blue, Gray, Gray},
    Filling -> {2 -> {3}}, Exclusions -> False,
    PerformanceGoal -> "Speed",
    PlotLegends -> {"Prediction", "Confidence Interval"}],
    ListPlot[List @@@ data, PlotStyle -> Red, PlotLegends -> {"Data"}]]
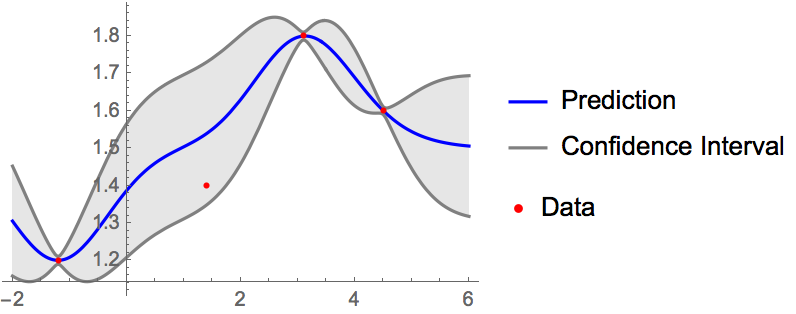
It produces the following figure:

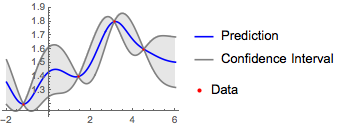
It's really weird that the point {1.4, 1.4} is far away from the predictive mean, represented by the blue line. Interestingly, in introducing the new features on Version 11., the official site gives exactly the same example, but with a different, and more 'reasonable', result, shown in the following figure:

So I am wondering if someone could help explain what is happening here. Since Bayesian optimization also uses Gaussian Process as far as I know, I am also worrying about the Bayesian optimization implementation too...
