3
$\begingroup$

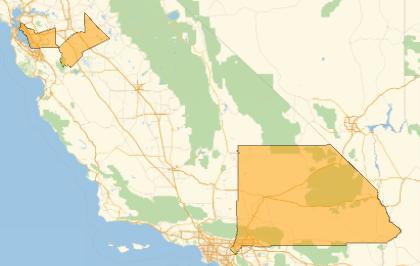
I have a GeoListPlot as below. How can I get the latitude/longitude coordinates of the 4 vertexes of the GeoListPlot? I need the 4 vertexes to reconstruct the rectangle.

g = GeoListPlot@{
Entity["AdministrativeDivision", {"SanBernardinoCounty", "California", "UnitedStates"}], 
Entity["AdministrativeDivision", {"StanislausCounty", "California", "UnitedStates"}], 
Entity["AdministrativeDivision", {"AlamedaCounty", "California", "UnitedStates"}]
}

enter image description here

Many thanks!

$\endgroup$
0

1 Answer 1

3
$\begingroup$
PlotRange /. AbsoluteOptions[g]

{{-122.746, -113.724}, {35.7826, 41.5036}}

GeoRange /. AbsoluteOptions[g]

{{33.6605, 38.2878}, {-122.746, -113.724}}

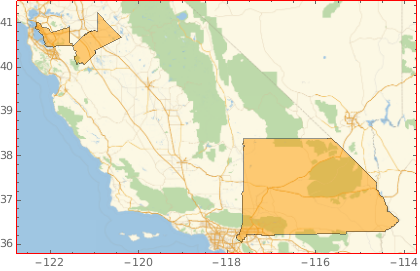
Show[g, Frame -> True, Epilog -> {Opacity[.25], EdgeForm[Red], FaceForm[], 
 Rectangle @@ Transpose[PlotRange /. AbsoluteOptions[g]]}]

enter image description here

$\endgroup$
1
  • $\begingroup$ Not sure for the exact reason, but when the number of entities increase, PlotRange /. AbsoluteOptions[g] will have some errors, and GeoRange /. AbsoluteOptions[g] gives no error. The latter solves my problem. Many thanks! $\endgroup$
    – H42
    Commented Jul 2, 2018 at 21:31

Your Answer

By clicking “Post Your Answer”, you agree to our terms of service and acknowledge you have read our privacy policy.

Not the answer you're looking for? Browse other questions tagged or ask your own question.