(Salvaging from this post.)
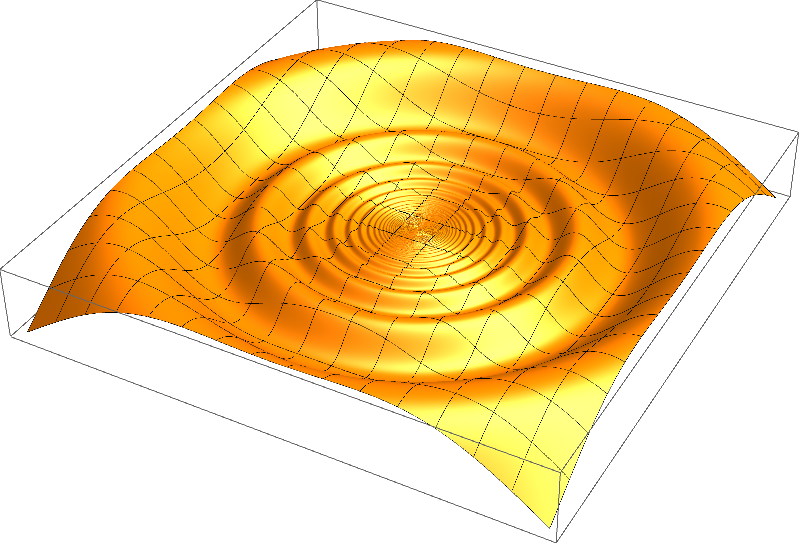
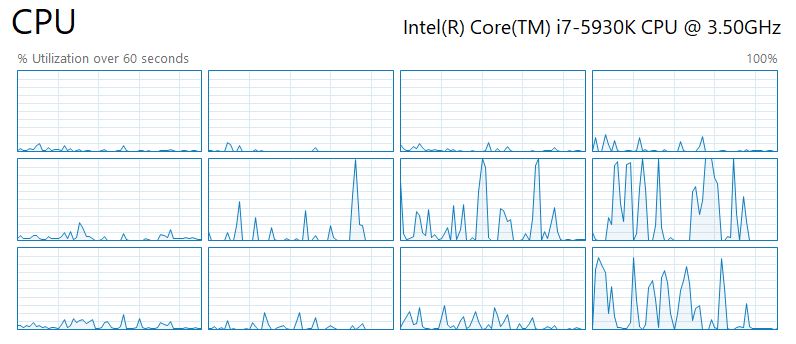
On my machine, thes following produces the image in about seven seconds. Note that over 95 percent of that time are spent solely by in the frontend, so further optimization is out of reach for me.
range = {{-1/8, 1/8}, {-1/8, 1/8}};
plotpoints = {100, 100} 8;
mesh = {16, 16};
f = {x, y} \[Function] Evaluate[(x^2 + y^2)*Sin[1/Sqrt[x^2 + y^2]]];
νf = {x, y} \[Function]
   Evaluate[-Cross @@ Transpose[D[{x, y, f[x, y]}, {{x, y}, 1}]]];

cfsurface = With[{code = {
      Compile`GetElement[X, 1],
      Compile`GetElement[X, 2],
      f[Compile`GetElement[X, 1], Compile`GetElement[X, 2]]}
    },
   Compile[{{X, _Real, 1}}, code, RuntimeAttributes -> {Listable}, Parallelization -> True]];

cνf =
  With[{code = νf[Compile`GetElement[X, 1], Compile`GetElement[X, 2]]},
   Compile[{{X, _Real, 1}}, code, RuntimeAttributes -> {Listable}, Parallelization -> True]];

getQuads =
  Compile[{{m, _Integer}, {n, _Integer}},
   Flatten[Table[{m (j - 1) + i, m (j - 1) + i + 1, m j + i + 1, m j + i}, {j, 1, n - 1}, {i, 1, m - 1}], 1],
   CompilationTarget -> "C", RuntimeOptions -> "Speed"];


xran = Sequence @@ N[range[[1]]];
yran = Sequence @@ N[range[[2]]];
xcoords = Subdivide[xran, plotpoints[[1]] - 1];
ycoords = Subdivide[yran, plotpoints[[2]] - 1];
pts2D = Tuples[{xcoords, ycoords}];
xlines = cfsurface@Outer[List, Subdivide[xran, mesh[[2]] - 1], ycoords];
ylines = Transpose@cfsurface@Outer[List, xcoords, Subdivide[yran, mesh[[2]] - 1]];

Graphics3D[{
  GraphicsComplex[
   cfsurface[pts2D],
   {EdgeForm[], Orange, Specularity[White, 30],
    Polygon[getQuads @@ plotpoints]},
   VertexNormals -> cνf[pts2D]
   ],
  Line@xlines,
  Line@ylines
  },
 Lighting -> "Neutral"]


