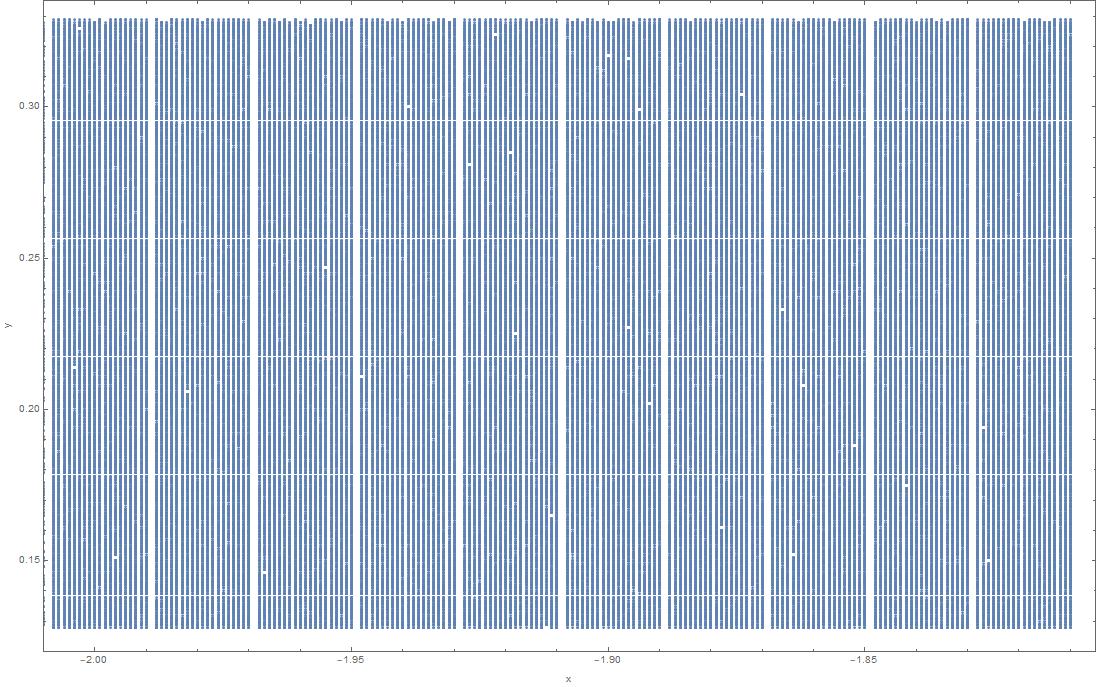
I am trying to create a specific type of colour map for some data. The data is in the form of a list with dimensions 300000 x 3, that is 300,000 sets of {x, y, n} where x and y are basically the $xy$ cartesian coordinates and n is a value either 0 or 1. Doing a list plot of the 300,000 points gives the following figure:
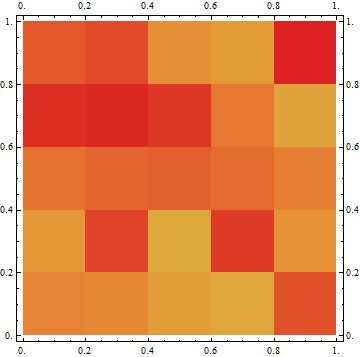
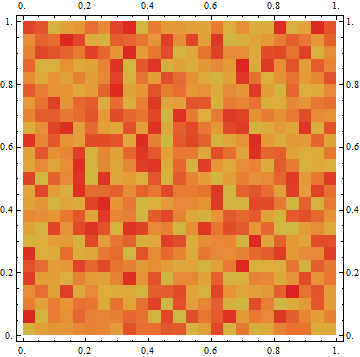
What I am trying to make is a colour map of this figure, that is made up of 5 x 5 evenly sized squares (so 25 all up), in which the colour-key denotes the mean of the n values of all the points within that square. Is this possible?
Please let me know if any additional information is needed,


