0
$\begingroup$

I have the following function:

$$f(x,j,G) = -(6.699719\times10^{-6})\times j\times G\times \frac{\sinh(\frac{x}{G})}{ \cosh(\frac{L}{2G})} $$

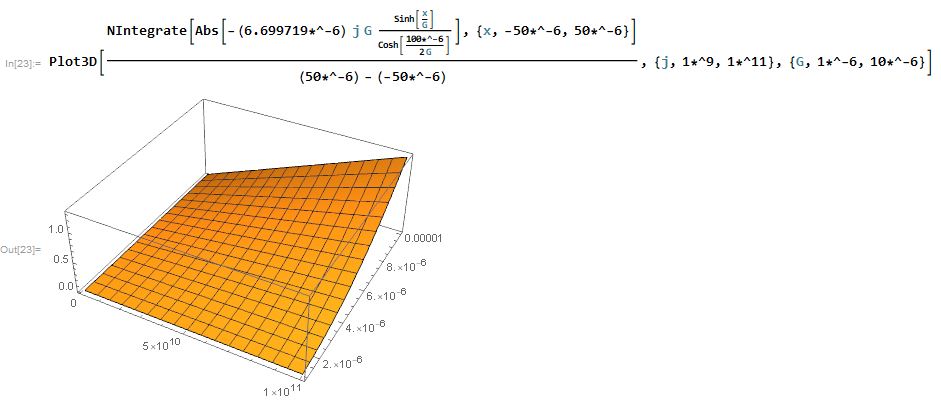
where $L=100\times10^{-6}$. I'm trying to plot its average value over $-L/2\leq x\leq L/2$ versus some values of $j$ and $G$. This is my attempt but does seem to be correct:

Plot3D[NIntegrate[Abs[-(6.699719*^-6) j G Sinh[x/G]/Cosh[100*^-6/(2 G)]], {x, -50*^-6,50*^-6}]/((50*^-6) - (-50*^-6)), {j, 1*^9, 1*^11}, {G, 1*^-6,10*^-6}]

enter image description here

I get different values in R. Any effort is appreciated.

$\endgroup$
6
  • $\begingroup$ Capitalization matters in this language; use Sinh[] and Cosh[]. Also, why is L not specified in your code? $\endgroup$ Commented Sep 7, 2017 at 5:57
  • $\begingroup$ @J.M. Thanks, updated my question. $\endgroup$ Commented Sep 7, 2017 at 5:59
  • $\begingroup$ What values you are getting in R? $\endgroup$
    – zhk
    Commented Sep 7, 2017 at 6:03
  • $\begingroup$ Have you considered rescaling your variables in the meantime? You are dealing with some excessive ranges here. $\endgroup$ Commented Sep 7, 2017 at 6:04
  • $\begingroup$ @zhk I'm trying to extract same graphs from R. Thanks for asking and your patience. $\endgroup$ Commented Sep 7, 2017 at 6:07

1 Answer 1

1
$\begingroup$

The function $f$ as written at the top of your question is odd in x (basically you're just integrating Sinh), so your mean $f$ vanishes integrating over $-\frac{L}{2} \le x\le \frac{L}{2}$. Everything else is along for the ride.

The numerical expression you're plotting is averaging Abs[Sinh[x]] which is even. That's fine and can still be done analytically.

In essence your calculation looks like:

meanAbsSinhX[L_, G_] = Integrate[Sqrt[Sinh[x/G]^2], {x, -L/2, L/2}]/L;

meanf[const_, G_, j_, L_] :=  Abs[const j G /Cosh[L/(2 G)]] meanAbsSinhX[L, G]

We can compare this with numerical integration on human readable values:

 meanf[1, 1, 1, 1] // N

0.226362

NIntegrate[ Abs[Sinh[x]/Cosh[1/2]], {x, -1/2, 1/2}]

0.226362

And you can reproduce your above plot with:

Plot3D[meanf[-(6.699719*10^-6) , g, j, 100*10^-6] // Evaluate, {j, 
  1.*10^9, 1.*10^11}, {g, 1.*10^-6, 10.*10^-6},ColorFunction -> None]

I should point out -- I have absolutely no way of knowing whether your numbers make sense, or if this is even the value you want to be plotting. The good news is your expression isn't very complicated and can be debugged analytically.

$\endgroup$

Your Answer

By clicking “Post Your Answer”, you agree to our terms of service and acknowledge you have read our privacy policy.

Not the answer you're looking for? Browse other questions tagged or ask your own question.