1
$\begingroup$

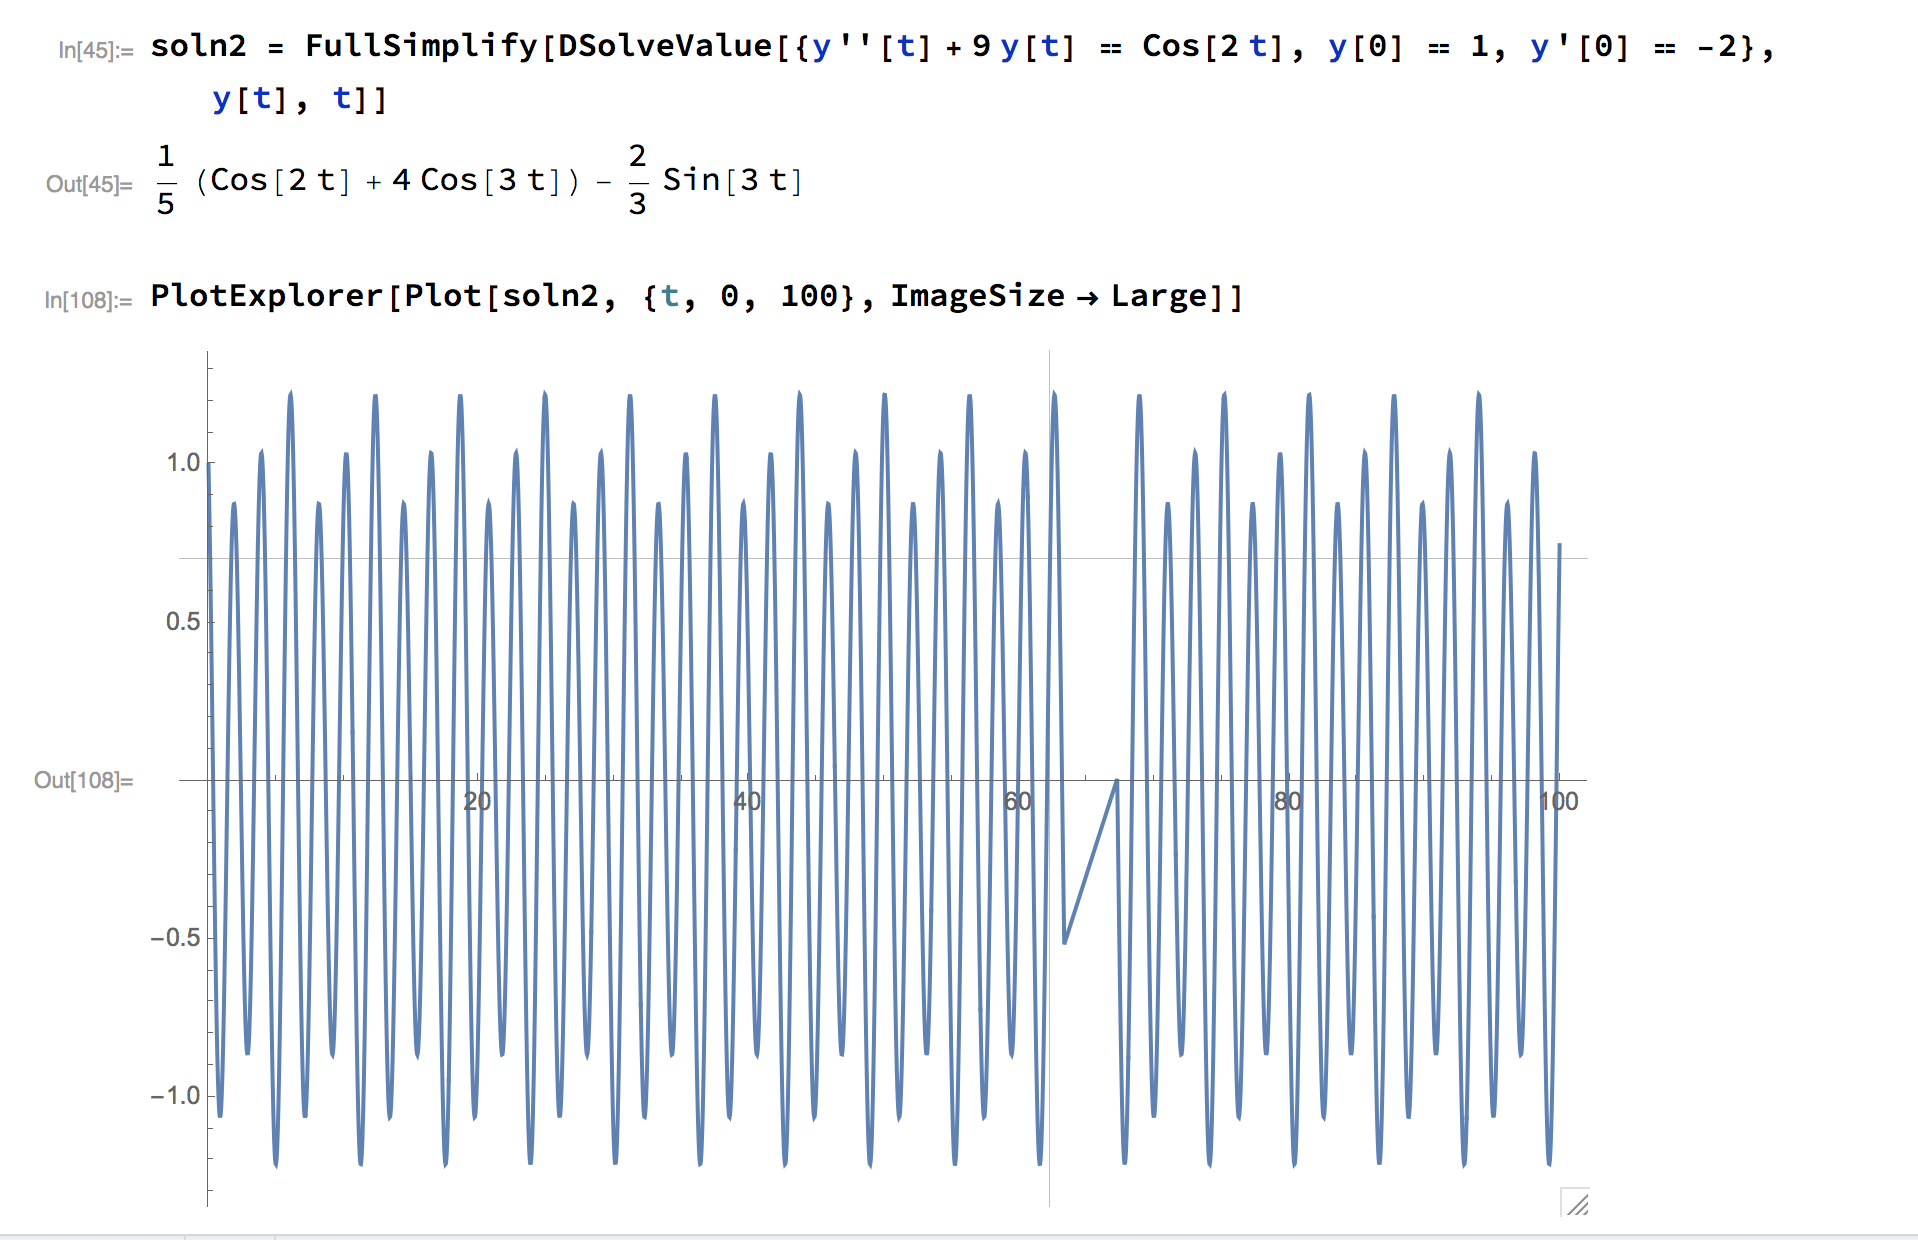
I've been trying to solve an ODE as shown below. The solution is correct. However, while trying to compare the Mathematica solution to the solution I had found by hand (which was not simplified), I decided to plot the two and compare. The plot of the Mathematica result shows an odd linear jump.

soln2 = FullSimplify[
DSolveValue[{y''[t] + 9 y[t] == Cos[2 t], y[0] == 1, y'[0] == -2}, y[t], t]]
1/5 (Cos[2 t] + 4 Cos[3 t]) - 2/3 Sin[3 t]
 Plot[soln, {t, 1, 100}, ImageSize -> Medium]

enter image description here

When trying some other intervals, like 1 to 100 or 0 to 99, or seemingly anything other than 0-100, I have the periodic result I expected with no sudden linear parts.

Evaluating by hand around this area in the interval reveils correct, expected answers.

N[x[65]]
N[x[64.5]]
N[x[63]]
0.560737
0.67255
0.566941
Plot[soln, {t, 1, 100}, ImageSize -> Medium]

Another photo of the plot zoomed in with 0-100 and 1-100... enter image description here
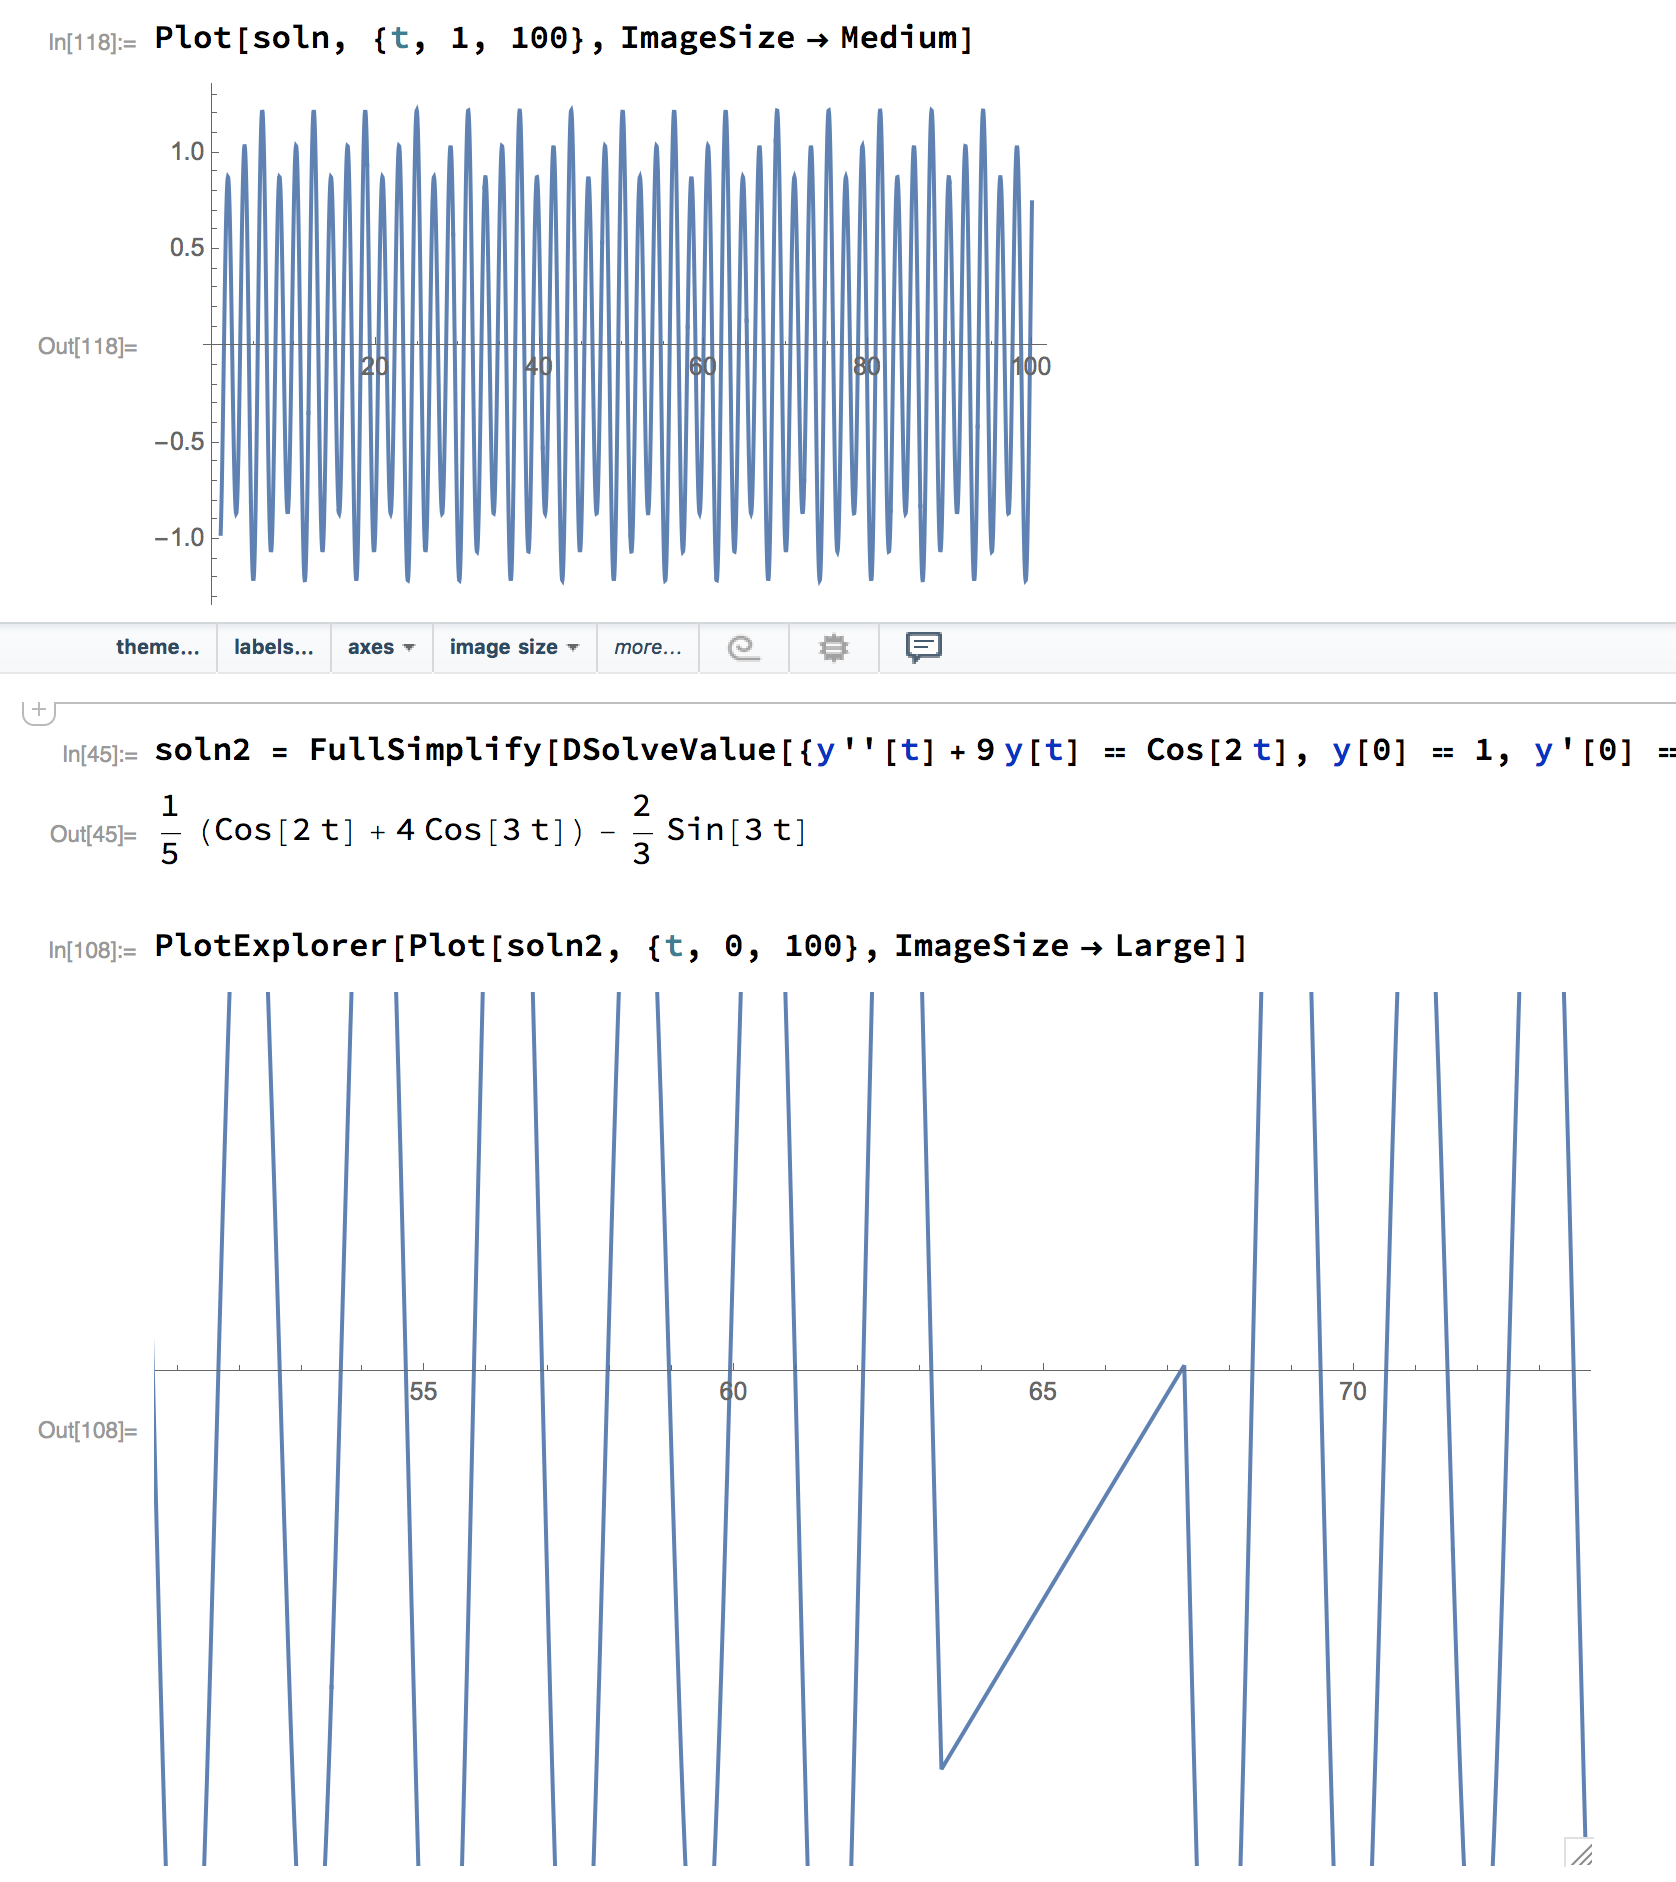
Is this a bug? Am I missing something? How can I trust the plot if it makes sudden bizarre mistakes like this?

I am running version 11.1.1 on MacOS sierra.

$\endgroup$
5
  • 2
    $\begingroup$ You just need some more PlotPoints. $\endgroup$
    – wxffles
    Commented Aug 30, 2017 at 21:33
  • $\begingroup$ Adding PlotPoints -> 10 to test, did seem to fix the issue....However why does it plot incorrectly in that specific interval? And not within 1-100 or 1-101? $\endgroup$ Commented Aug 30, 2017 at 21:41
  • 4
    $\begingroup$ As I understand it, and someone may correct me, Mathematica evaluates the function at a number of initial points. If neighbouring groups of points are linear, then it will just plot a straight section. If they are non-linear, it will add some more points to better define the curve. With your highly oscillating function, it's just luck whether a few points happen to line up. I'd recommend starting with perhaps 50 points instead of 10. $\endgroup$
    – wxffles
    Commented Aug 30, 2017 at 21:51
  • $\begingroup$ This is a duplicate of this old question: "Strange Sin[x] graph in Mathematica". Also strongly related: "How does Plot work?" $\endgroup$ Commented Aug 31, 2017 at 7:40
  • $\begingroup$ Ahh yes, pratically the same. Had I considered the word strange and graphs, I probably wouldn't have had to make a new post! $\endgroup$ Commented Aug 31, 2017 at 21:40

1 Answer 1

3
$\begingroup$

Mathematica evaluates the function at a number of initial points, which can be controlled with the PlotPoints option. If neighbouring groups of points are linear, then it will just plot a straight section. If they are non-linear, it will add some more points to better define the curve. With your highly oscillating function, it's just luck whether a few points happen to line up.

Let's construct an example to demonstrate this.

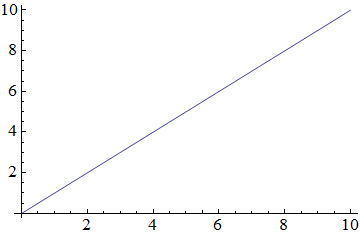
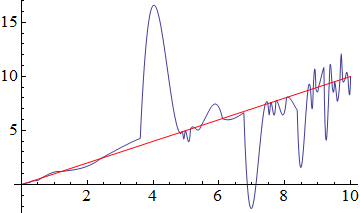
Plot[x, {x, 0, 10}, PlotPoints -> 3]

1

A straight line as expected. Now pull out the points at which the function is evaluated:

linear = Plot[(If[NumericQ@x, Sow@{x, x}]; x), {x, 0, 10}, 
  PlotPoints -> 3] // Reap // Last // Last // Sort

And put some random points inbetween:

nonlinear = {(#1[[1]] + #2[[1]])/2, (#1[[1]] + #2[[1]])/
  RandomReal[{1.5, 2.5}]} & @@@ Partition[linear, 2, 1]

Then interpolate all the points:

i = Interpolation[linear~Join~nonlinear]

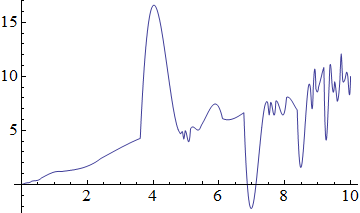
This gives a rather nonlinear plot as expected:

Plot[i[x], {x, 0, 10}]

2

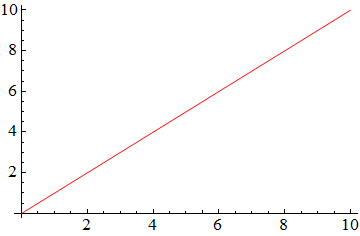
But if we put the PlotPoints back in, it plots as straight:

Plot[i[x], {x, 0, 10}, PlotPoints -> 3, PlotStyle -> Red]

3 4

$\endgroup$
4
  • 1
    $\begingroup$ "If neighbouring groups of points are linear, then it will just plot a straight section. If they are non-linear, it will add some more points to better define the curve." - more specifically, this is controlled by the (formerly documented) MaxBend option, where you specify the maximum angle (in degrees) between the neighboring line segments; witness the difference between Plot[(Cos[2 t] + 4 Cos[3 t])/5 - 2 Sin[3 t]/3, {t, 0, 100}, Method -> {MaxBend -> 20.}, PlotPoints -> 15] and Plot[(Cos[2 t] + 4 Cos[3 t])/5 - 2 Sin[3 t]/3, {t, 0, 100}, Method -> {MaxBend -> 10.}, PlotPoints -> 15]. $\endgroup$ Commented Aug 30, 2017 at 23:09
  • 1
    $\begingroup$ @J.M. MaxBend is deprecated since version 6 in favor of Method -> {"Refinement" -> {"ControlValue" -> maxBend*\[Degree]}}] as I described here (see "Edit 4" section). $\endgroup$ Commented Aug 31, 2017 at 7:46
  • $\begingroup$ @Alexey, I know about it; I just didn't have space left to fit in "ControlValue" in my already long comment. :D $\endgroup$ Commented Aug 31, 2017 at 7:57
  • $\begingroup$ Thanks for the clear explanation with example! $\endgroup$ Commented Aug 31, 2017 at 21:39

Your Answer

By clicking “Post Your Answer”, you agree to our terms of service and acknowledge you have read our privacy policy.

Not the answer you're looking for? Browse other questions tagged or ask your own question.