BoundaryDiscretizeRegion takes most of the options available to Graphics:
Complement[
    Options[Graphics][[All, 1]],
    Options[BoundaryDiscretizeRegion][[All, 1]]
]
{ColorOutput, ContentSelectable, CoordinatesToolOptions, FormatType, \
ImageSizeRaw, PreserveImageOptions}
This means, that you should be able to use Graphics options to control the appearance of the discretization. Rather than just giving you the options to use, I will show you how to find out what options are available for this purpose. The box form of Graphics is GraphicsBox, and the options for GraphicsBox are:
Options[GraphicsBox]
{AlignmentPoint -> Center, AspectRatio -> Automatic, Axes -> False,
AxesLabel -> None, AxesOrigin -> {Automatic, Automatic}, AxesStyle -> {},
Background -> None, BaseStyle -> {}, BaselinePosition -> Automatic,
ColorOutput -> Automatic, ContentSelectable -> Automatic,
CoordinatesToolOptions :> Automatic, DefaultAxesStyle -> "GraphicsAxes",
DefaultBaseStyle -> "Graphics", DefaultFrameStyle -> "GraphicsFrame",
DefaultFrameTicksStyle -> "GraphicsFrameTicks",
DefaultGridLinesStyle -> "GraphicsGridLines",
DefaultLabelStyle -> "GraphicsLabel", DefaultTicksStyle -> "GraphicsTicks",
Epilog -> {}, FormatType -> TraditionalForm, Frame -> False,
FrameLabel -> None, FrameStyle -> {}, FrameTicks -> Automatic,
FrameTicksStyle -> {}, GridLines -> None, GridLinesStyle -> {},
ImageMargins -> 0., ImageMarkers -> None, ImagePadding -> All,
ImageSize -> Automatic, ImageSizeRaw -> Automatic,
ImageSizeRules -> Automatic, LabelStyle -> {}, Method -> {},
PlotLabel -> None, PlotRange -> All, PlotRangeClipping -> False,
PlotRangePadding -> Automatic, PlotRegion -> {{0., 1.}, {0., 1.}},
PreserveImageOptions -> Automatic, Prolog -> {}, RotateLabel -> True,
Ticks -> Automatic, TicksStyle -> {}}
In particular, note the DefaultBaseStyle option:
Options[GraphicsBox, DefaultBaseStyle]
{DefaultBaseStyle -> "Graphics"}
The DefaultBaseStyle points to the style "Graphics". This style has the following settings:
CurrentValue[{StyleDefinitions, "Graphics"}]
{CellMargins -> {{4, Inherited}, {Inherited, Inherited}},
CellGroupingRules -> "GraphicsGrouping", StripStyleOnPaste -> False,
PageBreakWithin -> False, GeneratedCell -> True, CellAutoOverwrite -> True,
ShowCellLabel -> False, DefaultFormatType -> DefaultOutputFormatType,
ContextMenu -> {MenuItem["Cu&t Graphics Selection", "Cut"],
MenuItem["&Copy Graphics Selection", "Copy"],
MenuItem["&Paste into Graphic", FrontEnd`Paste[After]], Delimiter,
MenuItem["&Drawing Tools",
FrontEndExecute[{FrontEnd`NotebookOpen[
FrontEnd`FindFileOnPath["DrawingTools.nb",
"PrivatePathsSystemResources"]]}]],
MenuItem["&Get Coordinates",
FrontEndExecute[FrontEnd`Select2DTool["GetCoordinates"]]], Delimiter,
MenuItem["G&roup", "Group"], MenuItem["&Ungroup", "Ungroup"], Delimiter,
MenuItem["Move to &Front", "MoveToFront"],
MenuItem["Move to &Back", "MoveToBack"],
MenuItem["Move For&ward", "MoveForward"],
MenuItem["Move Bac&kward", "MoveBackward"]},
"AutoStyleOptionsHighlightMisspelledWords" -> False,
LanguageCategory -> "NaturalLanguage", FormatType -> StandardForm,
ShowStringCharacters -> False, NumberMarks -> False,
CounterIncrements -> "Graphics",
ImageMargins -> {{43, Inherited}, {Inherited, 0}}, Arrowheads -> 0.04,
Dashing -> None, CapForm -> "Square", JoinForm -> {"Miter", 3.25},
LineColor -> GrayLevel[0], LineOpacity -> 1, EdgeColor -> GrayLevel[0],
EdgeOpacity -> 1, EdgeThickness -> Medium, EdgeDashing -> None,
EdgeCapForm -> "Square", EdgeJoinForm -> {"Miter", 3.25},
FrontFaceColor -> GrayLevel[0], BackFaceColor -> GrayLevel[0],
FrontFaceOpacity -> 1, BackFaceOpacity -> 1, GraphicsColor -> GrayLevel[0],
PointSize -> Absolute[3], Thickness -> Medium, Opacity -> 1,
DrawEdges -> False, StyleMenuListing -> None, FontFamily -> "Arial",
FontSize -> 10, FontWeight -> "Plain", FontColor -> GrayLevel[0],
FontOpacity -> 1}
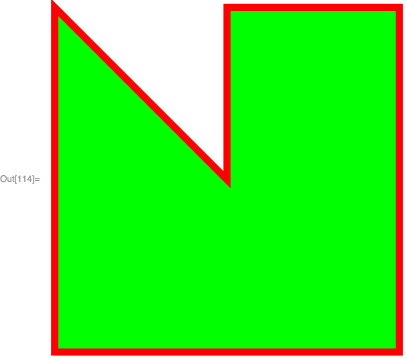
You see options controlling LineColor, EdgeColor, etc., and you can play with changing these settings to see what their effects are. To change the fill color and the edge color of your discretization, you could use:
BaseStyle -> {FrontFaceColor -> Green, EdgeColor -> Red, EdgeThickness -> .02}
Using this BaseStyle in your discretization produces:
BoundaryDiscretizeRegion[
    RegionUnion[Triangle[], Rectangle[{0.5, 0}, {1, 1}]],
    BaseStyle -> {FrontFaceColor -> Green, EdgeColor -> Red, EdgeThickness -> .02}
]


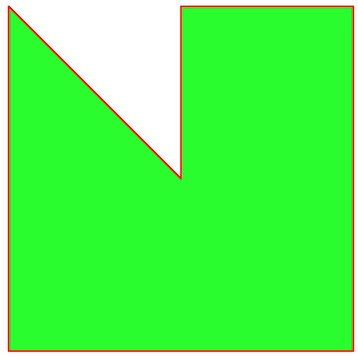
RegionPlot[RegionUnion[..]]works as expected, since as far as I can tell, nowhere in the documentation does it say that such a thing is supported. $\endgroup$RegionPlot[]that way in a Q here (can't remember which question, unfortunately). In any case, you bring up an interesting point. When I tryRegionPlot[BoundaryDiscretizeRegion[RegionUnion[Triangle[], Rectangle[{0.9, 0}, {1, 1}]]], {x, 0, 1}, {y, 0, 1}], I get all sorts of errors. Does this mean thatBoundaryDiscretizeRegion[]doesn't give me a legitimate region to plot withRegionPlot? $\endgroup$RegionPlotin this way? Is it just so that there are ticks? Is it because you need aGraphicsobject? $\endgroup$BoundaryDiscretizeRegion[ RegionUnion[Triangle[], Rectangle[{0.5, 0}, {1, 1}]], BaseStyle -> {FrontFaceColor -> Green, EdgeColor -> Red}]? $\endgroup$