13
$\begingroup$

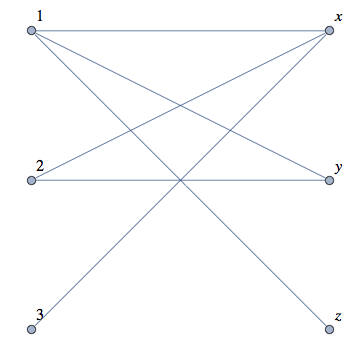
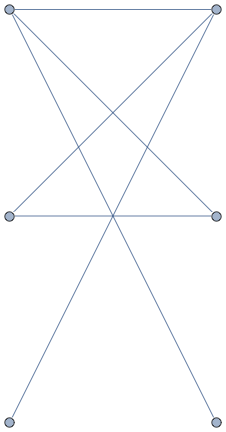
A bipartite graph is a graph whose vertices can be divided into two disjoint sets. Given two lists: {1, 2, 3} and {x, y, z}, where some of the elements are connected:

{{1, x}, {1, y}, {1, z},{2, x}, {2, y}, {3, x}}

I want to draw a bipartite graph with the numbers {1, 2, 3} on one side, the letters {x, y, z} on the other, and with edges connecting those which are paired together. How can I draw such a graph?

Furthermore, how can one generate bipartite graphs? All I was able to find in the Mathematica documentation is BipartiteGraphQ that tests whether or not a graph is bipartite. I found nothing on how to generate one. Is there a way to do this without the Combinatorica` package?

$\endgroup$
3
  • $\begingroup$ Welcome to Mathematica.SE! I suggest the following: 1) As you receive help, try to give it too, by answering questions in your area of expertise. 2)Read the FAQs! 3) When you see good Q&A, vote them up by clicking the gray triangles, because the credibility of the system is based on the reputation gained by users sharing their knowledge. ALSO, remember to accept the answer, if any, that solves your problem, by clicking the checkmark sign` $\endgroup$
    – chris
    Commented Nov 23, 2012 at 19:56
  • $\begingroup$ Do you need to draw (visualize) an existing graph or do you need to generate a new one? These are two different problems. $\endgroup$
    – Szabolcs
    Commented Nov 26, 2012 at 0:09
  • $\begingroup$ Recently I have been studying the same problem, but I managed to generalize it a bit for two disjoint sets of different length with both record keys and values. In the database field, this is an important visualization of mapping table columns onto fields of a records class. I am happy to share this with the rest of you. $\endgroup$ Commented Mar 8, 2016 at 16:07

6 Answers 6

6
$\begingroup$

One way is to specify VertexCoordinates:

g=Graph[{1 <-> x, 1 <-> y, 
  1 <-> z, 2 <-> x, 2 <-> y,
  3 <-> x}, 
 VertexCoordinates -> {{0, 2}, {1, 2}, {1, 1}, {1, 0}, {0, 1}, {0, 
    0}}]

bipartite graph

Note that the vertices {v1, v2, ...} are given in the order returned by VertexList.

VertexList[g]
(* {1, x, y, z, 2, 3} *)

Update

To automatize a bit the generation of bipartite graphs the way you want you could use this function:

bipartiteGraph[elements_List] := Module[{g1, el, c1, c2, cc, vrt},
  g1 = Graph[
    MapThread[
     UndirectedEdge, {Sort[elements][[All, 1]], 
      Sort[elements][[All, 2]]}]];
  el = VertexList[g1];
  c1 = Transpose[{Select[el, IntegerQ], 
     Table[{0, i}, {i, 1, 0, -1/(Length[Select[el, IntegerQ]] - 1)}]}];
  c2 = Transpose[{Complement[el, Select[el, IntegerQ]], 
     Table[{1, i}, {i, 1, 
       0, -1/(Length[Complement[el, Select[el, IntegerQ]]] - 1)}]}];
  cc = Join[c1, c2];
  vrt = cc[[Table[Position[cc, el[[i]]], {i, Length[cc]}][[All, 1, 
       1]], 2]];
  Graph[MapThread[
    UndirectedEdge, {Sort[elements][[All, 1]], 
     Sort[elements][[All, 2]]}], VertexCoordinates -> vrt, 
   VertexLabels -> "Name", VertexLabelStyle -> 16, 
   ImagePadding -> 20]
  ]

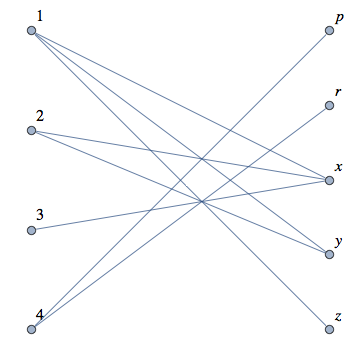
bipartiteGraph[{{1, x}, {1, y}, {1, z},{2, x}, {2, y}, {3, x}}]

bipartite graph

bipartiteGraph[{{4, p}, {1, x}, {1, y}, {1, z}, {2, x}, {2, y}, {3, x}, {4, r}}]

bipartite graph

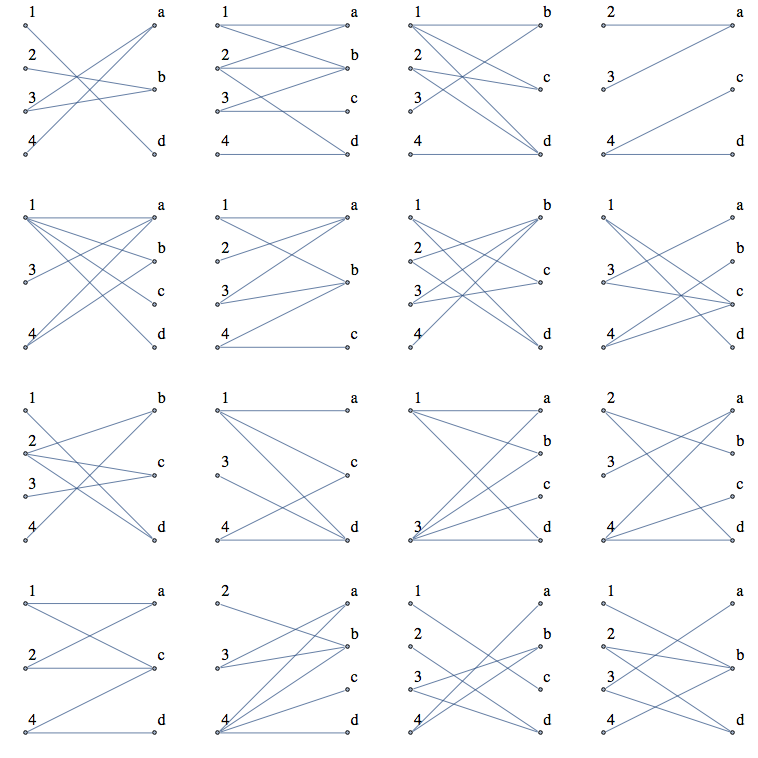
GraphicsGrid[Partition[
  Table[bipartiteGraph[
  Union[Transpose[{RandomInteger[{1, 4}, 8], 
   RandomChoice[CharacterRange["a", "d"], 8]}]]], {16}], 4]]

grid of bipartite graphs

$\endgroup$
5
  • $\begingroup$ Thanks VLC! That is definitely helpful, but what if I dont want to manually type out the links and the coordinates? I vary the amount of vertices on each side, and the connections are randomly generated from trial to trial. As you can tell, I am new at this... Thanks again for your help! $\endgroup$
    – Pancholp
    Commented Nov 23, 2012 at 18:45
  • $\begingroup$ @Pancholp Please, see update. $\endgroup$
    – VLC
    Commented Nov 25, 2012 at 21:57
  • $\begingroup$ That is immensely helpful! Thank you! $\endgroup$
    – Pancholp
    Commented Nov 26, 2012 at 0:55
  • $\begingroup$ @Pancholp Glad to be of some help. $\endgroup$
    – VLC
    Commented Nov 26, 2012 at 6:51
  • $\begingroup$ @VLC I think your approach does not cover a disconnected graph, i.e. two disjoint sets of different length. $\endgroup$ Commented Mar 8, 2016 at 15:59
8
$\begingroup$

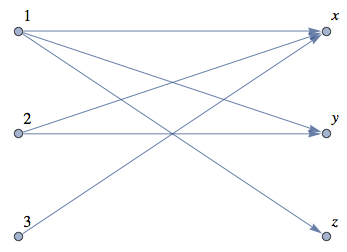
You can use BipartiteEmbedding:

Graph[{3, 2, 1, z, y, x}, DirectedEdge@@@{{1, x}, {1, y}, {1, z}, {2, x}, {2, y}, {3, x}}, 
GraphLayout -> "BipartiteEmbedding" , 
VertexLabels -> "Name", ImagePadding -> 15, VertexLabelStyle -> 16]

Mathematica automatically determines the vertex coordinates.

bipartite3

$\endgroup$
7
  • $\begingroup$ Thanks David! I will give this approach a shot as well! $\endgroup$
    – Pancholp
    Commented Nov 24, 2012 at 12:59
  • $\begingroup$ Note that if any of the nodes is unconnected, Mathematica places it at the bottom of the figure as a singleton when using "BipartiteEmbedding" (and not specifying vertex coordinates manually), yielding thus an ugly graph where vertex positions are messed up. $\endgroup$ Commented Mar 14, 2013 at 14:34
  • $\begingroup$ I suppose so. But a true bipartite graph should have no singletons. $\endgroup$
    – DavidC
    Commented Mar 14, 2013 at 15:38
  • $\begingroup$ @DavidCarraher, en.wikipedia.org/wiki/Bipartite_graph implies only that a bipartite graph edge cannot conntect vertices from the same part; not that every vertex is connected. $\endgroup$ Commented Nov 15, 2014 at 15:11
  • $\begingroup$ alancalvitti, Thanks for pointing that out. $\endgroup$
    – DavidC
    Commented Nov 15, 2014 at 15:54
5
$\begingroup$

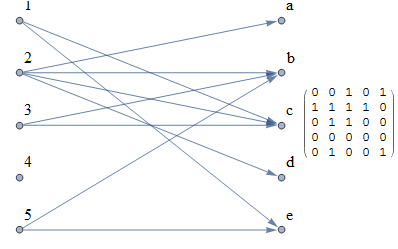
This is a bit different approach. A balanced bipartite graph (where the two vertex sets have the same cardinality, $N$) can be represented as an adjacency matrix, where the rows and columns of the matrix stand for the left and right side vertices, respectively. This approach generates a random adjacency matrix and translates it to edges, representing left nodes as $(1, 2, ..., N)$ and right nodes as $(N+1, N+2, ..., 2N)$. Letters are only used for labelling right-side vertices.

n = 5; (* node number of ONE side of the graph *)
m = RandomInteger[{0, 1}, {n, n}];

adjacencyToEdge[m_List] := Module[{n = Length@m}, 
   DeleteCases[Flatten@Table[If[m[[i, j]] == 1, i -> n + j], {i, n}, {j, n}], Null]];

Row@{
  Graph[Range[2 n], adjacencyToEdge@m, 
   VertexCoordinates -> Join[
     Table[{0, 1 - i/n}, {i, n}], Table[{1, 1 - i/n}, {i, Length@m}]], 
   VertexLabels -> Join[
     Thread[Range@n -> Range@n], 
     Thread[Range[n + 1, 2 n] -> Take[CharacterRange["a", "z"], n]]], 
   ImagePadding -> 10, VertexLabelStyle -> 16, ImageSize -> 300],
  MatrixForm@m}

Mathematica graphics

Note that even unconnected nodes are placed at the correct position (which GraphLayout -> "BipartiteEmbedding" won't do).

$\endgroup$
1
$\begingroup$

Bipartite Visualization and the Database Mapping Problem

This is a more generalized answer on the question that has been asked by @Pancholp. It works for two disjoint sets of unequal length, but most important you can view two groups of labels on each node. One group represents generated indexes that control the position of the nodes and the sorted order. The other group is for semantic role labeling.

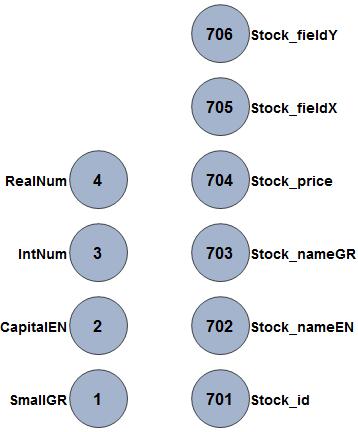
This is also an important visualization step on a database mapping problem. I am not sure how this is referenced in the literature. Basically you want to map the columns of a file table onto the fields of a record. In the following example, SmallGR, CapitalEN, IntNum and RealNum are the columns of the table and the other list of names is for the attributes of the database class.

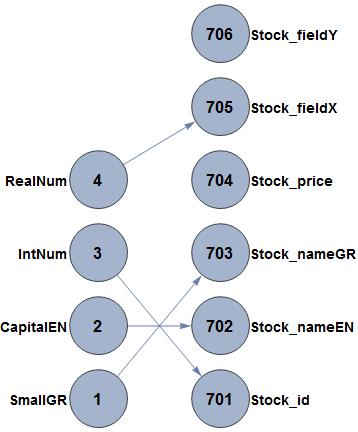
The bpGraph Graph function visualizes the bipartite set before the mapping. Then the user specifies the mapping with a list that is passed on bpGraph a second time.

{1 -> 703, 2 -> 702, 3 -> 701, 4 -> 705}

The final goal in such systems is to load data from specific columns of a data source or from multiple data sources on a single graph database class or onto many associated classes.

ClearAll["Global`*"]
colsNames = {"SmallGR", "CapitalEN", "IntNum", "RealNum"};
colsndxs = Association@MapIndexed[Rule[First[#2], #1] &, colsNames];

attrsNames = {"Stock_id", "Stock_nameEN", "Stock_nameGR", "Stock_price", "Stock_fieldX", "Stock_fieldY"};
attrsndxs = Association@MapIndexed[Rule[First[#2] + 700, #1] &, attrsNames];

len1 = Length@colsndxs;
len2 = Length@attrsndxs;
keys1 = Keys@colsndxs;
keys2 = Keys@attrsndxs;
step = 0.6;
lis1 = Table[{0, y1}, {y1, step, step*len1, step}];
lis2 = Table[{1, y1}, {y1, step, step*len2, step}];


vlabels = Join[
   MapThread[#1 -> Placed[
     {Style[#, 16, Bold], Style[#2, 14, Bold]}, {Center, Before}
     ] &, {keys1, colsNames}],
   MapThread[#1 -> Placed[
     {Style[#, 16, Bold], Style[#2, 14, Bold]}, {Center, After}
     ] &, {keys2, attrsNames}] ];

 Options[bpGraph] = {
    VertexLabelStyle -> Large,
    VertexSize -> {"Scaled", .15},
    ImageSize -> Medium,
    VertexCoordinates -> Automatic,
    VertexLabels -> Placed["Name", Center] };

 bpGraph[nds_, edgs_, opts : OptionsPattern[{bpGraph, Graph}]] :=
   Graph[nds, edgs, Sequence @@ FilterRules[
       Join[{opts}, Options[bpGraph]], Options[Graph] ]]

 SetOptions[bpGraph,
 VertexCoordinates -> Join[lis1, lis2],
 VertexLabels -> vlabels];

 before = bpGraph[Join[keys1, keys2], Map[(#1 -> #1) &, keys1]]

enter image description here

 after = bpGraph[Join[keys1, keys2], {1 -> 703, 2 -> 702, 3 -> 701, 4 -> 705}]

enter image description here

$\endgroup$
0
1
$\begingroup$

How to generate bipartite graphs? The same way as any graph: specify the edge list and use Graph.

IGraph/M has specific functions that return bipartite graphs:

  • IGBipartiteGameGNM and IGBipartiteGameGNP create random bipartite graphs with a given number of edges or a given connection probability.

  • IGBipartiteIncidenceGraph creates a bipartite graph from an incidence matrix

  • IGMeshCellAdjacencyGraph will create a bipartite graph when requesting the relationship between two different kinds of object (e.g. the incidence of edges and vertices in a mesh).

How to visualize them? As others said, there is the "BipartiteEmbedding" GraphLayout.

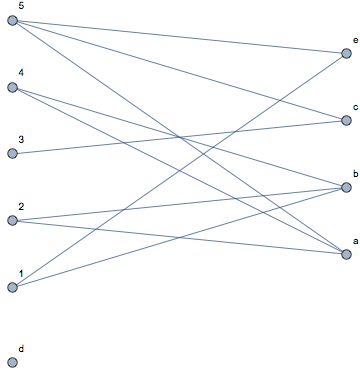
Additionally, IGraph/M has the IGLayoutBipartite visualization function, which can often produce a better layout: it aims to draw the graph in a way that there are as few edge crossings as possible.

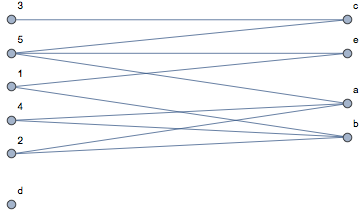
Consider the graph

g = Graph[{1, 2, 3, 4, 5, "a", "b", "c", "d", "e"}, {1 <-> "b", 1 <-> "e",
   2 <-> "a", 2 <-> "b", 3 <-> "c", 4 <-> "a", 4 <-> "b", 5 <-> "a", 
  5 <-> "c", 5 <-> "e"}, VertexLabels -> "Name", GraphLayout -> "BipartiteEmbedding"]

enter image description here

By default, the vertices are drawn in order.

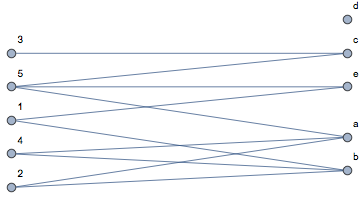
Draw it with fewer edge crossings instead:

IGLayoutBipartite[g]

enter image description here

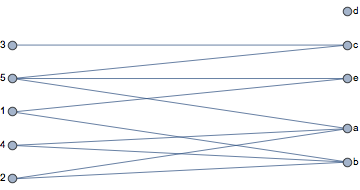
Explicitly specify which partition that unconnected node should be drawn in:

parts = {{1, 2, 3, 4, 5}, {"a", "b", "c", "d", "e"}};

IGLayoutBipartite[g, "BipartitePartitions" -> parts]

enter image description here

Place the labels on the outer side of the two columns:

IGLayoutBipartite[g, "BipartitePartitions" -> parts] //
 IGVertexMap[
  Placed[#, If[MemberQ[First[parts], #], Before, After]] &,
  VertexLabels -> VertexList]

enter image description here

$\endgroup$
0
$\begingroup$

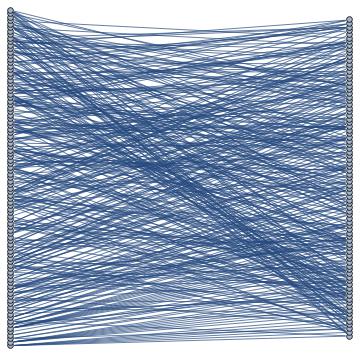
The following functions will allow you to both generate and plot bipartite undirected random graph.The two vertex sets may have different cardinality, say n1 and n2. The number of edges (l) is an input. The extension to a directed graph is trivial.

fromVtoG[u_,v_]:=u \[UndirectedEdge] v 
bipRanGraph[{n1_, n2_}, l_] := Graph[Union[MapThread[fromVtoG, {RandomInteger[{1, n1}, l], 
 RandomInteger[{n1 + 1, n1 + n2}, l]}]], GraphLayout -> "BipartiteEmbedding"]
bipRanGraph[{100, 90}, 400]

enter image description here

$\endgroup$

Your Answer

By clicking “Post Your Answer”, you agree to our terms of service and acknowledge you have read our privacy policy.

Not the answer you're looking for? Browse other questions tagged or ask your own question.