4
$\begingroup$

So I built an SE service connection and as a piece of pure curiosity I wanted to see if I could determine what a given user's time-zone was by the times which they answer.

I managed to pull in all the answers using my service connection.

And then I grouped the users and the hours of the day (in Unix time) when they answered and then I got stuck.

Because I can tell you when Mr. Wizard answers questions on average:

In[82]:= Mean@userTimes["Mr.Wizard"] // N

Out[82]= 11.6578

But this alone isn't enough to tell me what his(?) time-zone is (although per his/her profile it's PST: mr.wizard time).

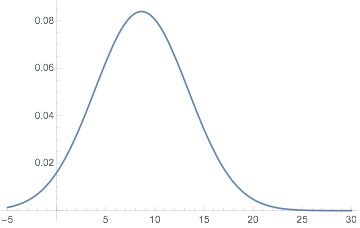
And I can give you an EstimatedDistribution (using NormalDistribution) of Kuba's answer times:

Plot[PDF[userDistributions["Kuba"], x], {x, -5, 30}]

kuba dist

But I don't know how to connect that to his time zone.

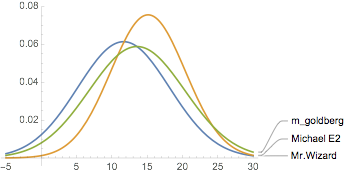
I know Mathematica should be able to give me this, maybe by comparing both the peak and the height in the distribution:

Plot[
 PDF[#, x] & /@ Take[userDistributions, 3] // Values // Evaluate,
 {x, -5, 30},
 PlotLabels -> Keys@Take[userDistributions, 3]
 ]

top-three dist

But this is simply not something I know enough about.

So can someone crack the code? As I have it set-up I suppose this breaks down to a statistical argument about how likely it is that a given user has a given time-zone, but is there a way to do this better than just that (if I even knew how to do that)?

$\endgroup$
1
  • $\begingroup$ I stumbled onto this today. Some ideas: (1) I am male. (2) I think many people often post at a couple of times each day (e.g. before and after work), so I would try a bimodal distribution for each profile to see if it fits better. (3) You should consider my data a pathological case (unfortunately, it is) – stackoverflow.com/a/5845444/618728 $\endgroup$
    – Mr.Wizard
    Commented Jan 11, 2019 at 13:08

1 Answer 1

1
$\begingroup$

So I ended up trying to use Classify on this. First I pulled in all of the users.

Then I found the ones where I could get a property city or admin. div. Entity:

$stateMap =
  AssociationThread[#,
     Interpreter["AdministrativeDivision"][#]
     ] &@DeleteDuplicates@Normal@users[All, "location"];

$cityMap =
  AssociationThread[#,
     Interpreter["City"][#]
     ] &@Keys@Select[$stateMap, FailureQ];

$locMap = 
  Join[Select[$cityMap, Not@*FailureQ], 
   Select[$stateMap, Not@*FailureQ]];

userLocs = 
  Association[
    First@# -> (Last@# /. $locMap) & /@ 
     Normal@users[All, {"display_name", "location"}]] // Dataset;

testableUsers = Select[userLocs, MatchQ[_Entity]];

Then I calculated the shifts from UTC for these users:

calcedShifts = <||>;

calcShit[ent_] :=
 Lookup[calcedShifts, ent,
  calcedShifts[ent] =
   Check[
      TimeZoneOffset[#],
      QuantityMagnitude[#["OffsetFromUTC"], "Hours"]
      ] &@
    If[EntityTypeName@ent === "AdministrativeDivision",
     First[ent["TimeZones"]],
     ent["TimeZone"]
     ]
  ]

userShifts = calcShit /@ Normal@testableUsers;

And then I built a classifier mapping the distribution parameters to the time-zone shift:

trainingSet =
  DeleteCases[
   Thread[
    Lookup[userDistParams,
      Normal@Keys[userShifts]] ->
     Normal@Values[userShifts]
    ],
   _Missing -> _
   ];

classifier = Classify[trainingSet];

timeZoneGuess[user_] :=

 classifier[userDistParams[user], "Probabilities"] // ReverseSort // 
  Dataset
timeZoneGuess[users : {__String}] :=

  Dataset@AssociationMap[Normal@timeZoneGuess[#] &, users];

And then we test:

In[349]:= 
Map[First@*Keys]@
  timeZoneGuess@Keys@Take[userDistributions, 15] // Normal

Out[349]= <|"Mr.Wizard" -> -5., "Michael E2" -> -5., 
 "m_goldberg" -> -5., "corey979" -> -5., "Szabolcs" -> 2., 
 "kglr" -> -5., "Bob Hanlon" -> -5., "ubpdqn" -> 2., "Kuba" -> 2., 
 "J. M." -> -5., "Carl Woll" -> -5., "george2079" -> -5., "zhk" -> 2.,
  "bill s" -> -5., "David G. Stork" -> -5.|>

And we find that it isn't so great... (obviously this is just the most probable time-zone guess from a fit to a NormalDistribution. Using something more sophisticated might help.)

But it is certainly a start. And it does seem to classify America vs. Europe fine.

$\endgroup$
2
  • $\begingroup$ You have "circular" data. Perhaps you should consider using the Von Mises distribution, which is appropriate for such data. If it were me, I might go farther and compute non-parametric density estimates for each user, using the Von Mises distribution as the kernel. $\endgroup$
    – mef
    Commented Aug 14, 2017 at 17:39
  • $\begingroup$ @mef interesting suggestion. I'll give it a try when I have time. $\endgroup$
    – b3m2a1
    Commented Aug 18, 2017 at 21:03

Your Answer

By clicking “Post Your Answer”, you agree to our terms of service and acknowledge you have read our privacy policy.

Not the answer you're looking for? Browse other questions tagged or ask your own question.