3
$\begingroup$

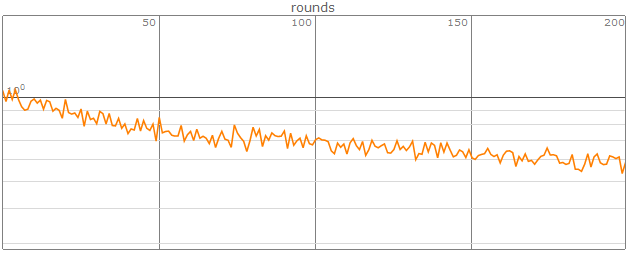
Using same net and similar data,but MSE loss is very different.

This is the original data,and it can not learn very well.

originalData = Get["https://wolfr.am/lRWRvwBp"];
originalGenerator = <|"EmbeddingLayerInput" -> Rationalize@#[[All, 1]], "Input2" -> #[[All, 2 ;; 13]], "Output" -> #[[All, 14 ;;]]|> &@RandomSample[originalData, #BatchSize] &;

originalGenerator[<|"BatchSize" -> 3|>]

enter image description here

net = NetGraph[{EmbeddingLayer[128, "Input" -> NetEncoder[{"Class", Range[0, Max@data[[All, 1]]]}]], 
     CatenateLayer[], 512, Ramp, 43},
     {NetPort["EmbeddingLayerInput"] -> 1 -> 2, NetPort["Input2"] -> 2 -> 3 -> 4 -> 5},
     "Input2" -> 12]

enter image description here

NetTrain[net, originalGenerator, MeanSquaredLossLayer[],
 "LossEvolutionPlot", BatchSize -> 300, MaxTrainingRounds -> 200]

enter image description here

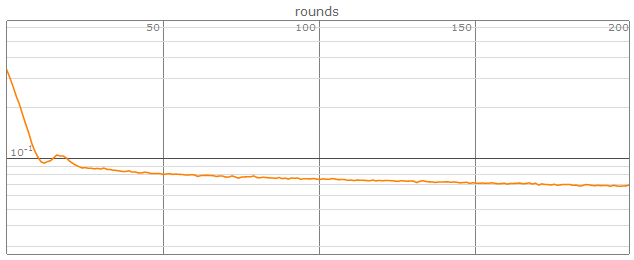
And this is test data,it learns well.

INPUTNOTE = Length[originalData];
testData = Transpose[{Join[List /@ originalData[[All, 1]], RandomReal[1, {INPUTNOTE, 12}], 2], RandomReal[1, {INPUTNOTE, 43}]}];
testGenerator = <|"EmbeddingLayerInput" -> Rationalize@#[[All, 1, 1]],"Input2" -> #[[All, 1, 2 ;;]], "Output" -> #[[All, 2]]|> &@RandomSample[testData, #BatchSize] &;

testGenerator[<|"BatchSize" -> 3|>]

enter image description here

NetTrain[net, testGenerator, MeanSquaredLossLayer[], 
  "LossEvolutionPlot", BatchSize -> 300, MaxTrainingRounds -> 200]

enter image description here

So why using similar data but different level of MES loss?

I guess weather the scale of different dimensions is too big,so I try originalData[[All, 2 ;;]] = Standardize /@ originalData[[All, 2 ;;]];,but not work.

And how to pre-process data to get much smaller MSE loss?

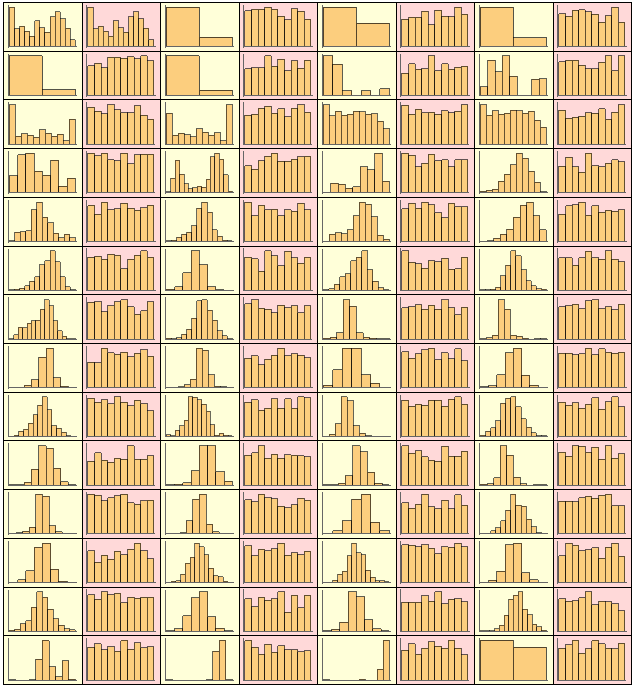
Ps: I draw the histogram of every dimension of data,yellow is original data,red is test data:

originalHist = Histogram[#, 10, Ticks -> None] & /@ Transpose[originalData];
testHist = Histogram[#, 10, Ticks -> None] & /@ Transpose[Flatten /@ testData];
GraphicsGrid[Partition[Flatten@Transpose@{originalHist, testHist}, 8],Frame -> All, Background -> {{{LightYellow, LightRed}}, None}]

enter image description here

View the histogram plot can find the histogram of test data is more stable.Is this the reason why second example better than first?

$\endgroup$
3
  • $\begingroup$ I don't know how do you upload your data into "https://wolfr.am/lRWRvwBp".Does this solution will cost your Credit Values? $\endgroup$
    – yode
    Commented May 23, 2017 at 16:45
  • $\begingroup$ it only use URLShorten. $\endgroup$
    – partida
    Commented May 24, 2017 at 0:12
  • $\begingroup$ And there are many websites provide urlshorten server. $\endgroup$
    – partida
    Commented May 24, 2017 at 0:20

1 Answer 1

4
$\begingroup$

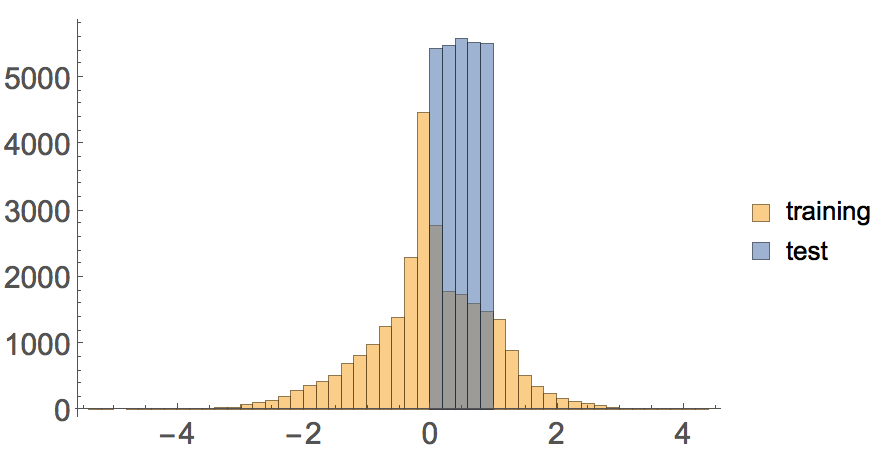
If we plot the distribution of your training and testing data, we can see they are very different:

originalData = Get["https://wolfr.am/lRWRvwBp"];
originalData[[All, 2 ;;]] = Standardize /@ originalData[[All, 2 ;;]];

Histogram[{Flatten[originalData[[All, 2 ;;]]], 
  Flatten[{testData[[All, 1, 2 ;;]], testData[[All, 2]]}]}, 
 PlotRange -> All]

We see that even after you standardi We see that even after you standardize the training data, there is still a large portion of them outside of the range of 1. This sometimes will make the convergence slow, since some of the ReLU units will be saturated or dead and the gradient will not flow in the network.

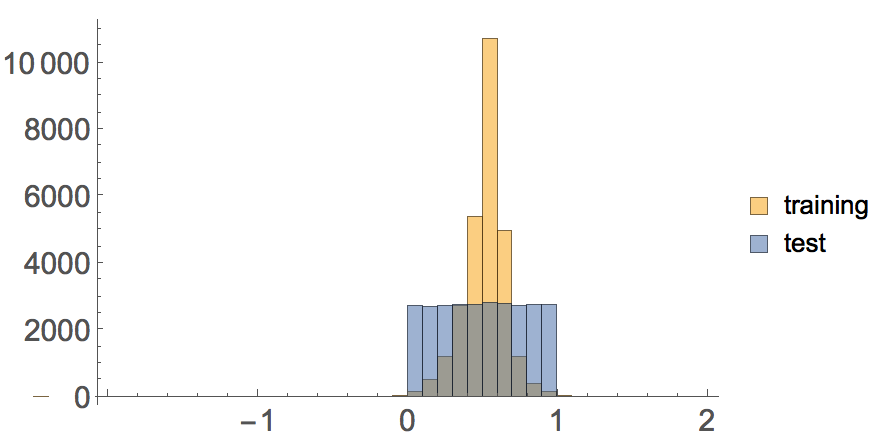
This can be solved by shifting the data into the region of 1:

originalData = Get["https://wolfr.am/lRWRvwBp"];
originalData[[All, 2 ;;]] = 
  0.5 + originalData[[All, 2 ;;]]/Max[originalData[[All, 2 ;;]]];

enter image description here

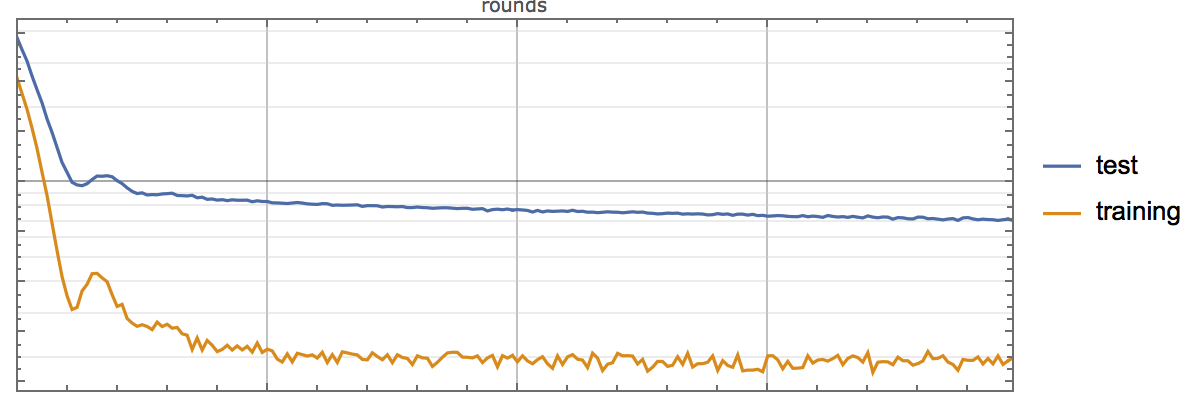
Now the training converges much faster

enter image description here

$\endgroup$
3
  • $\begingroup$ Cool!!!!! It solve my problem.Converges much faster!!! $\endgroup$
    – partida
    Commented May 24, 2017 at 1:54
  • $\begingroup$ But I have question,is min-max normalization better than mean-std normalization in this problem? $\endgroup$
    – partida
    Commented May 24, 2017 at 1:55
  • $\begingroup$ @partida I think in this case min-max is better because you are using relu activation and you want to put most of the data in [0,1] to minimize saturation. $\endgroup$ Commented May 24, 2017 at 15:28

Your Answer

By clicking “Post Your Answer”, you agree to our terms of service and acknowledge you have read our privacy policy.

Not the answer you're looking for? Browse other questions tagged or ask your own question.