edited title
Link
partida
  • 6.9k
  • 24
  • 48

Similar data,same net,different level of MSE loss?

added 41 characters in body
Source Link
partida
  • 6.9k
  • 24
  • 48

Using same net and similar data,but MSE loss is very different.

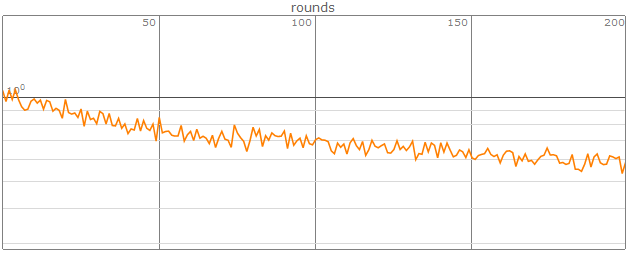
This is the original data,and it can not learn very well.

originalData = Get["https://wolfr.am/lRWRvwBp"];
originalGenerator = <|"EmbeddingLayerInput" -> Rationalize@#[[All, 1]], "Input2" -> #[[All, 2 ;; 13]], "Output" -> #[[All, 14 ;;]]|> &@RandomSample[originalData, #BatchSize] &;

originalGenerator[<|"BatchSize" -> 3|>]

enter image description here

net = NetGraph[{EmbeddingLayer[128, "Input" -> NetEncoder[{"Class", Range[0, Max@data[[All, 1]]]}]], 
     CatenateLayer[], 512, Ramp, 43},
     {NetPort["EmbeddingLayerInput"] -> 1 -> 2, NetPort["Input2"] -> 2 -> 3 -> 4 -> 5},
     "Input2" -> 12]

enter image description here

NetTrain[net, originalGenerator, MeanSquaredLossLayer[],
 "LossEvolutionPlot", BatchSize -> 300, MaxTrainingRounds -> 200]

enter image description here

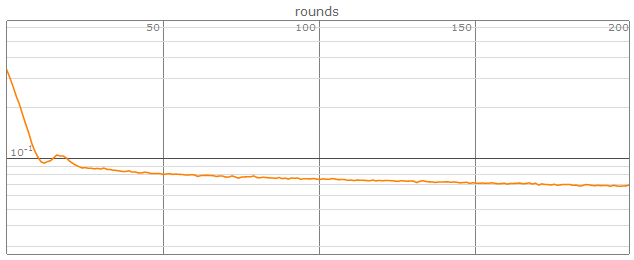
And this is test data,it learns well.

INPUTNOTE = Length[originalData];
testData = Transpose[{Join[List /@ originalData[[All, 1]], RandomReal[1, {INPUTNOTE, 12}], 2], RandomReal[1, {INPUTNOTE, 43}]}];
testGenerator = <|"EmbeddingLayerInput" -> Rationalize@#[[All, 1, 1]],"Input2" -> #[[All, 1, 2 ;;]], "Output" -> #[[All, 2]]|> &@RandomSample[testData, #BatchSize] &;

testGenerator[<|"BatchSize" -> 3|>]

enter image description here

NetTrain[net, testGenerator, MeanSquaredLossLayer[], 
  "LossEvolutionPlot", BatchSize -> 300, MaxTrainingRounds -> 200]

enter image description here

So why using similar data but different level of MES loss?

I guess weather the scale of different dimensions is too big,so I try originalData[[All, 72 ;;]] = Standardize /@ originalData[[All, 72 ;;]];,but not work.

And how to pre-process data to get much smaller MSE loss?

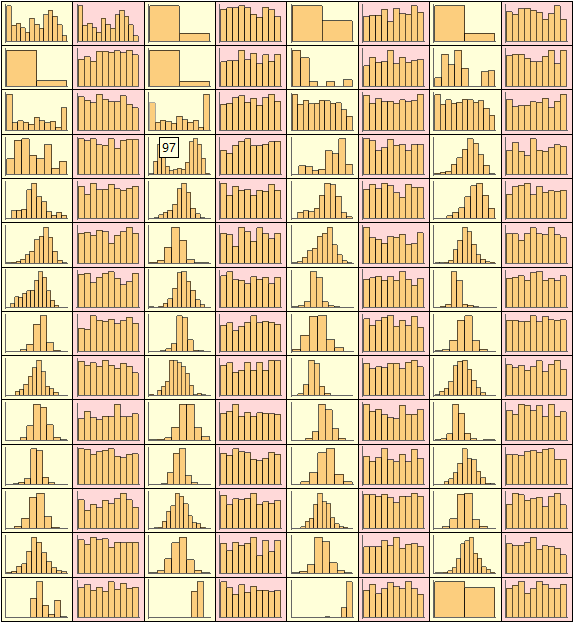
Ps: I draw the histogram of every dimension of data,yellow is original data,red is test data:

originalHist = Histogram[#, 10, Ticks -> None] & /@ Transpose[originalData];
testHist = Histogram[#, 10, Ticks -> None] & /@ Transpose[Flatten /@ testData];
GraphicsGrid[Partition[Flatten@Transpose@{originalHist, testHist}, 8],Frame -> All, Background -> {{{LightYellow, LightRed}}, None}]

enter image description hereenter image description here

View the histogram plot can find the histogram of test data is more stable.Is this the reason why second example better than first?

Using same net and similar data,but MSE loss is very different.

This is the original data,and it can not learn very well.

originalData = Get["https://wolfr.am/lRWRvwBp"];
originalGenerator = <|"EmbeddingLayerInput" -> Rationalize@#[[All, 1]], "Input2" -> #[[All, 2 ;; 13]], "Output" -> #[[All, 14 ;;]]|> &@RandomSample[originalData, #BatchSize] &;

originalGenerator[<|"BatchSize" -> 3|>]

enter image description here

net = NetGraph[{EmbeddingLayer[128, "Input" -> NetEncoder[{"Class", Range[0, Max@data[[All, 1]]]}]], 
     CatenateLayer[], 512, Ramp, 43},
     {NetPort["EmbeddingLayerInput"] -> 1 -> 2, NetPort["Input2"] -> 2 -> 3 -> 4 -> 5},
     "Input2" -> 12]

enter image description here

NetTrain[net, originalGenerator, MeanSquaredLossLayer[],
 "LossEvolutionPlot", BatchSize -> 300, MaxTrainingRounds -> 200]

enter image description here

INPUTNOTE = Length[originalData];
testData = Transpose[{Join[List /@ originalData[[All, 1]], RandomReal[1, {INPUTNOTE, 12}], 2], RandomReal[1, {INPUTNOTE, 43}]}];
testGenerator = <|"EmbeddingLayerInput" -> Rationalize@#[[All, 1, 1]],"Input2" -> #[[All, 1, 2 ;;]], "Output" -> #[[All, 2]]|> &@RandomSample[testData, #BatchSize] &;

testGenerator[<|"BatchSize" -> 3|>]

enter image description here

NetTrain[net, testGenerator, MeanSquaredLossLayer[], 
  "LossEvolutionPlot", BatchSize -> 300, MaxTrainingRounds -> 200]

enter image description here

So why using similar data but different level of MES loss?

I guess weather the scale of different dimensions is too big,so I try originalData[[All, 7 ;;]] = Standardize /@ originalData[[All, 7 ;;]];,but not work.

And how to pre-process data to get much smaller MSE loss?

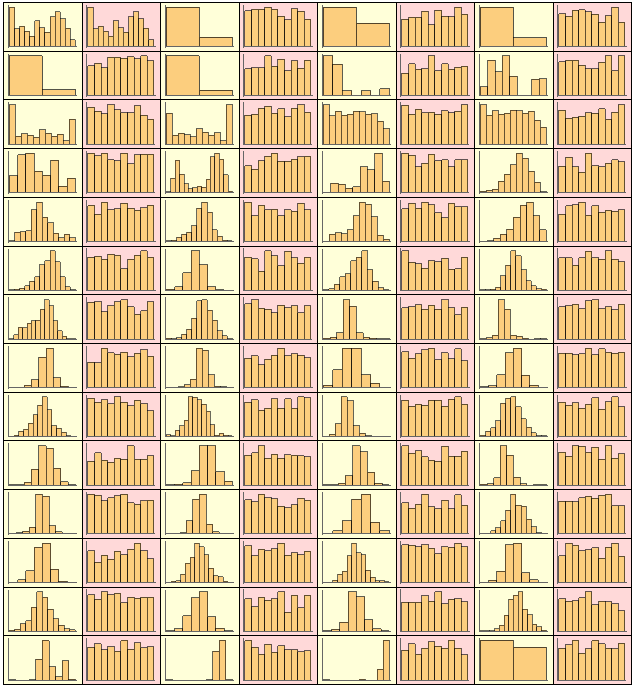
Ps: I draw the histogram of every dimension of data,yellow is original data,red is test data:

originalHist = Histogram[#, 10, Ticks -> None] & /@ Transpose[originalData];
testHist = Histogram[#, 10, Ticks -> None] & /@ Transpose[Flatten /@ testData];
GraphicsGrid[Partition[Flatten@Transpose@{originalHist, testHist}, 8],Frame -> All, Background -> {{{LightYellow, LightRed}}, None}]

enter image description here

View the histogram plot can find the histogram of test data is more stable.Is this the reason why second example better than first?

Using same net and similar data,but MSE loss is very different.

This is the original data,and it can not learn very well.

originalData = Get["https://wolfr.am/lRWRvwBp"];
originalGenerator = <|"EmbeddingLayerInput" -> Rationalize@#[[All, 1]], "Input2" -> #[[All, 2 ;; 13]], "Output" -> #[[All, 14 ;;]]|> &@RandomSample[originalData, #BatchSize] &;

originalGenerator[<|"BatchSize" -> 3|>]

enter image description here

net = NetGraph[{EmbeddingLayer[128, "Input" -> NetEncoder[{"Class", Range[0, Max@data[[All, 1]]]}]], 
     CatenateLayer[], 512, Ramp, 43},
     {NetPort["EmbeddingLayerInput"] -> 1 -> 2, NetPort["Input2"] -> 2 -> 3 -> 4 -> 5},
     "Input2" -> 12]

enter image description here

NetTrain[net, originalGenerator, MeanSquaredLossLayer[],
 "LossEvolutionPlot", BatchSize -> 300, MaxTrainingRounds -> 200]

enter image description here

And this is test data,it learns well.

INPUTNOTE = Length[originalData];
testData = Transpose[{Join[List /@ originalData[[All, 1]], RandomReal[1, {INPUTNOTE, 12}], 2], RandomReal[1, {INPUTNOTE, 43}]}];
testGenerator = <|"EmbeddingLayerInput" -> Rationalize@#[[All, 1, 1]],"Input2" -> #[[All, 1, 2 ;;]], "Output" -> #[[All, 2]]|> &@RandomSample[testData, #BatchSize] &;

testGenerator[<|"BatchSize" -> 3|>]

enter image description here

NetTrain[net, testGenerator, MeanSquaredLossLayer[], 
  "LossEvolutionPlot", BatchSize -> 300, MaxTrainingRounds -> 200]

enter image description here

So why using similar data but different level of MES loss?

I guess weather the scale of different dimensions is too big,so I try originalData[[All, 2 ;;]] = Standardize /@ originalData[[All, 2 ;;]];,but not work.

And how to pre-process data to get much smaller MSE loss?

Ps: I draw the histogram of every dimension of data,yellow is original data,red is test data:

originalHist = Histogram[#, 10, Ticks -> None] & /@ Transpose[originalData];
testHist = Histogram[#, 10, Ticks -> None] & /@ Transpose[Flatten /@ testData];
GraphicsGrid[Partition[Flatten@Transpose@{originalHist, testHist}, 8],Frame -> All, Background -> {{{LightYellow, LightRed}}, None}]

enter image description here

View the histogram plot can find the histogram of test data is more stable.Is this the reason why second example better than first?
added 631 characters in body
Source Link
partida
  • 6.9k
  • 24
  • 48

Using same net and similar data,but MSE loss is very different.

This is the original data,and it can not learn very well.

originalData = Get["https://wolfr.am/lRWRvwBp"];
originalGenerator = <|"EmbeddingLayerInput" -> Rationalize@#[[All, 1]], "Input2" -> #[[All, 2 ;; 13]], "Output" -> #[[All, 14 ;;]]|> &@RandomSample[originalData, #BatchSize] &;

originalGenerator[<|"BatchSize" -> 3|>]

enter image description here

net = NetGraph[{EmbeddingLayer[128, "Input" -> NetEncoder[{"Class", Range[0, Max@data[[All, 1]]]}]], 
     CatenateLayer[], 512, Ramp, 43},
     {NetPort["EmbeddingLayerInput"] -> 1 -> 2, NetPort["Input2"] -> 2 -> 3 -> 4 -> 5},
     "Input2" -> 12]

enter image description here

NetTrain[net, originalGenerator, MeanSquaredLossLayer[],
 "LossEvolutionPlot", BatchSize -> 300, MaxTrainingRounds -> 200]

enter image description here

INPUTNOTE = Length[originalData];
testData = Transpose[{Join[List /@ originalData[[All, 1]], RandomReal[1, {INPUTNOTE, 12}], 2], RandomReal[1, {INPUTNOTE, 43}]}];
testGenerator = <|"EmbeddingLayerInput" -> Rationalize@#[[All, 1, 1]],"Input2" -> #[[All, 1, 2 ;;]], "Output" -> #[[All, 2]]|> &@RandomSample[testData, #BatchSize] &;

testGenerator[<|"BatchSize" -> 3|>]

enter image description here

NetTrain[net, testGenerator, MeanSquaredLossLayer[], 
  "LossEvolutionPlot", BatchSize -> 300, MaxTrainingRounds -> 200]

enter image description here

So why using similar data but different level of MES loss?

I guess weather the scale of different dimensions is too big,so I try originalData[[All, 7 ;;]] = Standardize /@ originalData[[All, 7 ;;]];,but not work.

And how to pre-process data to get much smaller MSE loss?

Ps: I draw the histogram of every dimension of data,yellow is original data,red is test data:

originalHist = Histogram[#, 10, Ticks -> None] & /@ Transpose[originalData];
testHist = Histogram[#, 10, Ticks -> None] & /@ Transpose[Flatten /@ testData];
GraphicsGrid[Partition[Flatten@Transpose@{originalHist, testHist}, 8],Frame -> All, Background -> {{{LightYellow, LightRed}}, None}]

enter image description here

View the histogram plot can find the histogram of test data is more stable.Is this the reason why second example better than first?

Using same net and similar data,but MSE loss is very different.

This is the original data,and it can not learn very well.

originalData = Get["https://wolfr.am/lRWRvwBp"];
originalGenerator = <|"EmbeddingLayerInput" -> Rationalize@#[[All, 1]], "Input2" -> #[[All, 2 ;; 13]], "Output" -> #[[All, 14 ;;]]|> &@RandomSample[originalData, #BatchSize] &;

originalGenerator[<|"BatchSize" -> 3|>]

enter image description here

net = NetGraph[{EmbeddingLayer[128, "Input" -> NetEncoder[{"Class", Range[0, Max@data[[All, 1]]]}]], 
     CatenateLayer[], 512, Ramp, 43},
     {NetPort["EmbeddingLayerInput"] -> 1 -> 2, NetPort["Input2"] -> 2 -> 3 -> 4 -> 5},
     "Input2" -> 12]

enter image description here

NetTrain[net, originalGenerator, MeanSquaredLossLayer[],
 "LossEvolutionPlot", BatchSize -> 300, MaxTrainingRounds -> 200]

enter image description here

INPUTNOTE = Length[originalData];
testData = Transpose[{Join[List /@ originalData[[All, 1]], RandomReal[1, {INPUTNOTE, 12}], 2], RandomReal[1, {INPUTNOTE, 43}]}];
testGenerator = <|"EmbeddingLayerInput" -> Rationalize@#[[All, 1, 1]],"Input2" -> #[[All, 1, 2 ;;]], "Output" -> #[[All, 2]]|> &@RandomSample[testData, #BatchSize] &;

testGenerator[<|"BatchSize" -> 3|>]

enter image description here

NetTrain[net, testGenerator, MeanSquaredLossLayer[], 
  "LossEvolutionPlot", BatchSize -> 300, MaxTrainingRounds -> 200]

enter image description here

So why using similar data but different level of MES loss?

I guess weather the scale of different dimensions is too big,so I try originalData[[All, 7 ;;]] = Standardize /@ originalData[[All, 7 ;;]];,but not work.

And how to pre-process data to get much smaller MSE loss?

Ps: I draw the histogram of every dimension of data,yellow is original data,red is test data:

originalHist = Histogram[#, 10, Ticks -> None] & /@ Transpose[originalData];
testHist = Histogram[#, 10, Ticks -> None] & /@ Transpose[Flatten /@ testData];
GraphicsGrid[Partition[Flatten@Transpose@{originalHist, testHist}, 8],Frame -> All, Background -> {{{LightYellow, LightRed}}, None}]

enter image description here

View the histogram plot can find the histogram of test data is more stable.Is this the reason why second example better than first?
added 30 characters in body
Source Link
partida
  • 6.9k
  • 24
  • 48
Loading
added 30 characters in body
Source Link
partida
  • 6.9k
  • 24
  • 48
Loading
added 30 characters in body
Source Link
partida
  • 6.9k
  • 24
  • 48
Loading
added 30 characters in body
Source Link
partida
  • 6.9k
  • 24
  • 48
Loading
Source Link
partida
  • 6.9k
  • 24
  • 48
Loading