10
$\begingroup$

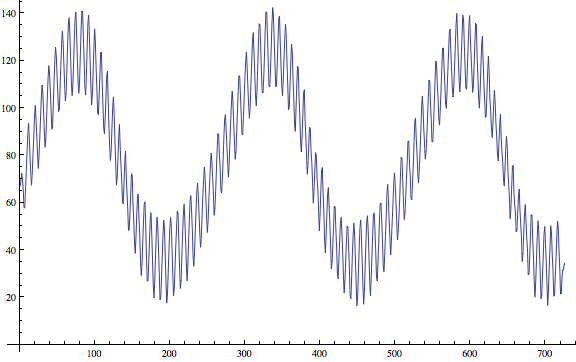
I have the following image: (which is a oscillation of the "magnetic susceptibility of gold" in y-direction, in arbitrary units, over the "magnetic field strength" from bmin = 36540 Gauss to bmax = 36784 Gauss, in x-direction).

pic = Import["https://i.sstatic.net/P6JOc.png"]

plot image

Even if it looks periodic, it should not be so, it must be periodic in 1/x (i.e. in the reciprocal of the field strength). Changing the image to a plot over 1/x I already succeeded in with the following Mathematica function:

bmin := 36540;

bmax := 36784;

f[a_, b_] := {1/(1/bmin - 1/bmax) (1/(a*(bmax - bmin) + bmin) - 1/bmax), b} 

img = ImageTransformation[pic, f[#[[1]], #[[2]]] &, PlotRange -> Automatic]

Now I get an image which looks quite similar and goes from 1/bmax to 1/bmin in the x-direction. From that image I now want to obtain the data points (along x) in y direction, such that I can do a Fourier Transform to obtain the frequencies and hence the periods in the reciprocal field strength.

How would I do that the easiest way?

btw: The background is that my professor wants us to obtain those frequencies in a problem set on the De-Haas-Van-Alphen-effct but obviously "by hand" with ruler and pen on a printed version of the graph...and I´m not gonna do that :)

$\endgroup$

1 Answer 1

9
$\begingroup$

Transform your image into a grayscale version, no alpha channel, and negate the color:

img = RemoveAlphaChannel[ColorNegate@ColorConvert[img, "Grayscale"]]

Then, extract the array of pixel values:

data = ImageData[ColorConvert[img, "Grayscale"]];
Dimensions@data
  (* return {156, 726} *)

In that array, white is 1 and black is 0. Then, simply calculate for each row the weighted average:

Total[Table[i*#[[i]], {i, Length@#}]]/Total@# & /@ Transpose[data];

(I'm sure there are more elegant ways to do that, without a table…) Then plot the result:

ListLinePlot[Flatten@%]

    enter image description here

Voilà!

PS: I'd advise you to perform that on the original, scanned image instead, and only transform the coordinates afterward. (Also note: in that very narrow region of abscissa, the inversion $x \rightarrow 1/x$ is probably close enough to linear that you can neglect it…


Edit — okay, one mistake: the data as obtained by the above method has an inverted $y$ axis. You can fix it with:

t = Flatten[Total[Table[i*#[[i]], {i, Length@#}]]/Total@# & /@ Transpose[data]];
ListLinePlot[Dimensions[data][[1]] - # & /@ t]

Plotting the obtained data on top of the original picture reveals that it works well:

Show[
 pic,
 ListLinePlot[Dimensions[data][[1]] - # & /@ t, 
  PlotStyle -> Directive[Thick, Red]]]

enter image description here

However, you can see that some of the amplitude of the original data is lost due to the averaging procedure.

$\endgroup$
2
  • $\begingroup$ Thank you for your answer! But unfortunately I don't understand much of it. In the array you've named "data" you have for each point in the x-y-plane a value between 0 and 1, with white correspondig to 1 and black to 0 and in between is what? And to which image belong those, to the inverted one or the original? And that explained what does the function Total[Table[i*#[[i]], {i,Length@#}]]/Total@# & /@ Transpose[data]; actually do (I do not understand the syntax - I'm not that strong with mathematica & image processing at all). $\endgroup$
    – user4621
    Commented Nov 12, 2012 at 23:03
  • $\begingroup$ And finally the curvature of your plot does not agree with the one in the original and neither with the 1/x transformed original!? (This got cut off from tobi's "answer"...) $\endgroup$ Commented Nov 13, 2012 at 0:19

Your Answer

By clicking “Post Your Answer”, you agree to our terms of service and acknowledge you have read our privacy policy.

Not the answer you're looking for? Browse other questions tagged or ask your own question.