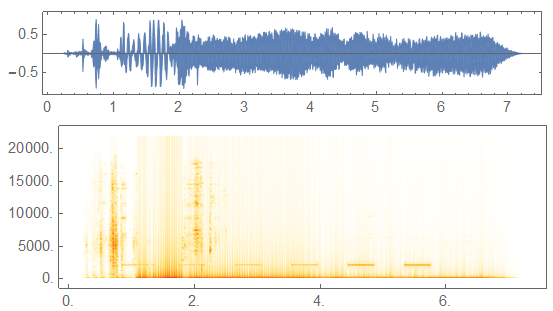
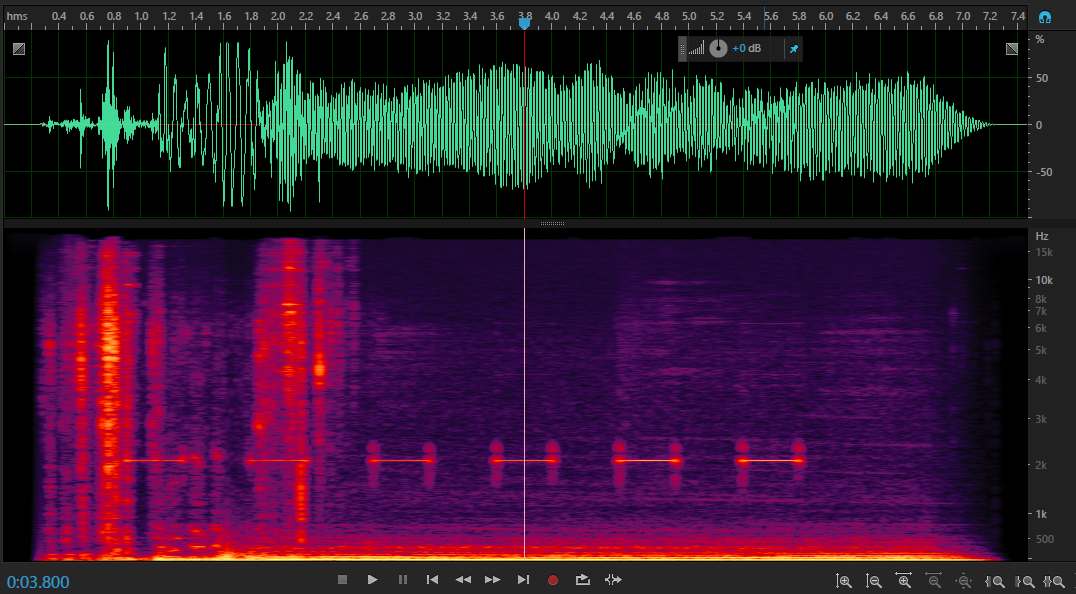
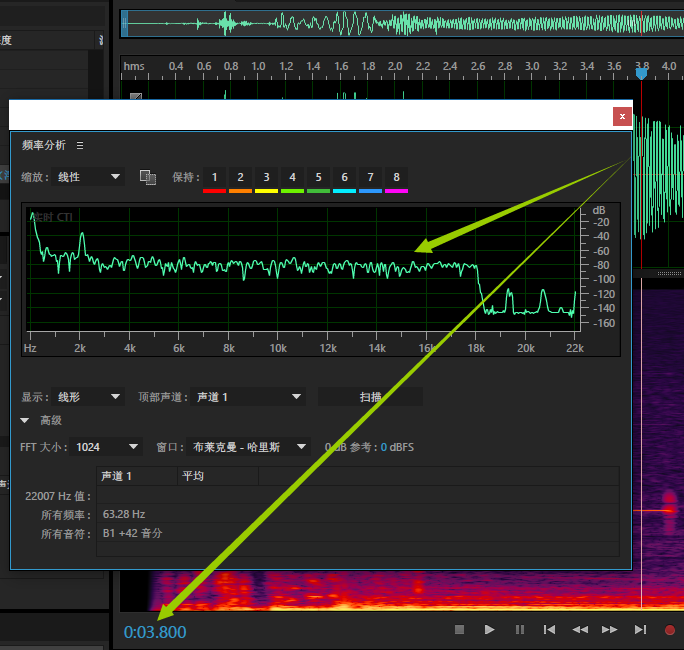
I've been trying all day to figure out how to do this. I have been able to import the data without any problem and have been able to also plot just the data. However, I keep getting error messages whenever I am trying to do anything with the FFT and I don't know why nothing is happening. All I am trying to do is plot the Fourier Transform so that I can see which frequencies are playing at different amplitudes.
This is what I've done to get the file in.
signal = Import["C:\\Users\\Joshua\\Downloads\\Sound Samples\\INSTRUMENTS single \samples\\horns and brass\\bachtrumpet_d4.wav", "Data"];
I can plot it just fine
ListPlot[signal, Joined -> False, PlotRange -> All]
and then I can get the Fourier Transform without any problem (and I have tried multiple methods) This is the easy method
dft = Fourier[signal]
But then there's a problem with attempting to plot it
In[9]:= ListLinePlot[Part[dft, 1 ;; 20000], PlotRange -> Full]

During evaluation of In[9]:= Part::take: Cannot take positions 1 through
20000 in {{-7.03996+0. I,0.255089 +0.109254 I,0.153395 +0.137607 I,0.101421
+0.108852 I,<<44>>,0.00897083 -0.0093402 I,-0.0446355+0.0773417 I,
<<127950>>},{-1.57903+0. I,<<49>>,<<127950>>}}. >>

During evaluation of In[9]:= ListLinePlot::lpn: {{-7.03996+0. I,0.255089
+0.109254 I,0.153395 +0.137607 I,0.101421 +0.108852 I,<<44>>,0.00897083
-0.0093402 I,-0.0446355+0.0773417 I,<<127950>>},{-1.57903+0. I,<<49>>,
<<127950>>}}[[<<1>>]] is not a list of numbers or pairs of numbers. >>

During evaluation of In[9]:= ListLinePlot::lpn: {{-7.03996+0. I,0.255089
+0.109254 I,0.153395 +0.137607 I,0.101421 +0.108852 I,<<44>>,0.00897083
-0.0093402 I,-0.0446355+0.0773417 I,<<127950>>},{-1.57903+0. I,<<49>>,
<<127950>>}}[[<<1>>]] is not a list of numbers or pairs of numbers. >>

Out[9]= Out[9]
Then I tried this more complicated method that I've used for previous examples and was able to get good results with it.
n = 5000;
DiscreteFourier[data_] :=
Module[{ft = Abs[Fourier[data[[All, 2]]]]},
datanew = RotateRight[ft, Quotient[Length[ft], 2]];
freq[t_] :=
With[{tau = t[[2]] - t[[1]], n = Length[t]},
Table[-tau/2 + i/(n tau), {i, 0, n - 1}]];
Take[Transpose[{freq[data[[All, 1]]],
 RotateRight[ft, Quotient[Length[data], 1]]}],
Round[Length[ft]/2]]]
But then when I even attempt to just put the wav file into this program, I get an endless amount of error messages.
One thing I have also tried doing to no avail is shortening the amount of data being analyzed
localizedtimedata = Table[signal[[j]], {j, 10000, 10100}];
I can do the same thing with this data set as I can do with the other data set, meaning plot just the data, but not anything with the Transform unfortunately.
If anybody could help me with this I would be extremely grateful. I need to do this kind of analysis for a lot of files.


Periodogram@Audio["file.wav"]should work in Mathematica 11.0 or later. $\endgroup$