7
$\begingroup$

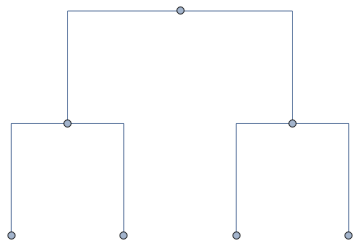
I want to create a plot that looks like the following: enter image description here

In essence, it is a symmetric plot with binary splits. I am a Mathematica novice and don't know how to do it.

I need to be able to set the following parameters:

  1. the number of split levels (in picture: 2)
  2. the total width
  3. the length of the vertical sections
  4. the channel width (identical for vertical and horizontal sections)

I was looking TreePlot initially, but that seemed very complicated with my desired parameters. Then I thought it should work with NestList to create all the edge points (since it is a symmetric structure) and then make a Graphics[] object out of it. Finally I want to export the geometry to a graphics program to be able to laser cut it.

I am grateful for any help!

$\endgroup$

3 Answers 3

4
$\begingroup$

This is just a starting point, not a full answer.

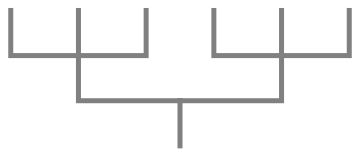
You can make an appropriate Graph, use the "LayeredEmbedding" or "LayeredDigraphEmbedding" GraphLayout, and design a custom EdgeShapeFunction.

edge[{{x1_, y1_}, ___, {x2_, y2_}}, _] := 
 Line[{{x1, y1}, {x2, y1}, {x2, y2}}]

KaryTree[7, EdgeShapeFunction -> edge]

Mathematica graphics

This will generalize well because you can use it with in an arbitrary graph. You can set the EdgeStyle, get rid of vertices, etc. to control the result better.

The following is just an example to show what parameters you can control. You will probably not want to use all of these. Be sure to look up the suboptions of the various relevant graph layouts.

KaryTree[10, 3, 
 GraphLayout -> {"LayeredEmbedding", "RootVertex" -> 4, 
   "Orientation" -> Bottom, "LeafDistance" -> 3, 
   LayerSizeFunction -> (2 &)},
 EdgeShapeFunction -> edge, 
 EdgeStyle -> Directive[Opacity[1], AbsoluteThickness[5], Gray], 
 VertexShapeFunction -> None]

There is also the slightly different IGLayoutReingoldTilford layout functions from the IGraph/M package. You may be able to get more control over the precise sizing.

Mathematica graphics

$\endgroup$
3
  • $\begingroup$ I am currently trying to adapt your ideas to my needs. I think I am already quite far, but one thing I don't understand (there is very little documentation on it) is "LeafDistance". What exactly does it do? What units does it have (printer points, pixel, ...)? $\endgroup$
    – Niki
    Commented Apr 9, 2017 at 18:06
  • $\begingroup$ @Niki I do not know. I put in frames to see the exact size, but the units do not make sense to me. If you get frustrated with this, you can try my IGraph/M package, as I suggested above. Example: IGLayoutReingoldTilford[ Uncompress@Compress@KaryTree[10, 3], "RootVertices" -> {4}, EdgeShapeFunction -> edge, "Rotation" -> Pi, "LayerHeight" -> 1, "LeafDistance" -> 1, EdgeStyle -> Directive[Opacity[1], AbsoluteThickness[5], Gray], VertexShapeFunction -> None, FrameTicks -> Automatic, Frame -> True]. The Compress/Uncompress thing is to work around a Mathematica bug ... $\endgroup$
    – Szabolcs
    Commented Apr 9, 2017 at 19:56
  • $\begingroup$ @Niki The units are plain plot units with the IGraph/M layout functions. $\endgroup$
    – Szabolcs
    Commented Apr 9, 2017 at 19:57
4
$\begingroup$

In versions 10.4+, Dendrogram produces desired shapes when input a Graph with VertexWeights.

In the following, we add vertex 0 to CompleteKaryTree with n levels and obtain the required VertexWeights based on the layer a node occupies. The resulting vertex-weighted graph is used as input to Dendrogram. The function dendrogramF below constructs the appropriate graph to pass to Dendrogram and postprocesses the output to produce the desired results.

The first argument of the function dendrogramF (nk = {n, k}) controls the number of layers (n) and, optionally, the arity (k). A singleton list {n} for the argument gives binary tree with n levels. The second argument (length) of the function modifies the vertex weights to give the desired length for the vertical sections. The third argument (w) controls the AbsoluteThickness of the lines to give the desired channel widths. We don't have an argument to control Total width directly; desired horizontal width can be obtained playing with the settings of the ImageSize option.

dendrogramF[color_ : Black, o : OptionsPattern[]] := 
  Module[{nk = #, length = #2, w = #3, ckat, ckat2, edges, vertices, vertexweights},
    ckat = CompleteKaryTree[##& @@ nk, DirectedEdges -> True];
    edges = Sort[Sort /@ EdgeList[ckat2 = EdgeAdd[ckat, 0 -> 1]]];
    vertices = Sort@VertexList[ckat2];
    vertexweights = length (Reverse[ArrayComponents[Reverse[Length /@ 
      (VertexOutComponent[ckat2, #] & /@ vertices)]]] - 1);
    Show[Dendrogram[Graph[edges, VertexWeight -> vertexweights], Bottom] /.
     l : Line[__] :> {color, AbsoluteThickness[w], (l /. {{a_, b_}, {a_, b_}} :> Nothing)},
     o, AspectRatio -> 1/2]] &;

Examples:

dendrogramF[][{3}, 1, 20]
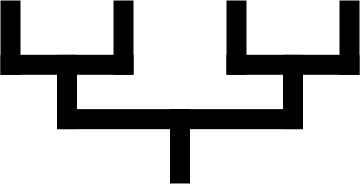
enter image description here

dendrogramF[][{4}, 1, 15]

enter image description here

dendrogramF[Black, AspectRatio -> 1/2, ImageSize -> 600][{4, 3}, 1, 10]
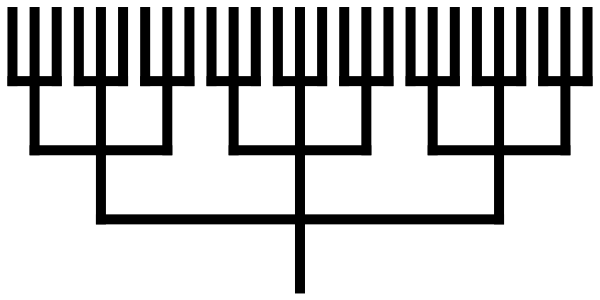
enter image description here

dendrogramF[Black, AspectRatio -> 1/4, ImageSize -> 700][{5, 3}, 1, 5]

enter image description here

dendrogramF[Blue, AspectRatio -> 1/4, ImageSize -> 500][{3, 6}, 1, 5]

enter image description here

dendrogramF[Blue, AspectRatio -> 1/4, ImageSize -> 700][{6, 3}, 1, 1]

enter image description here

dendrogramF[Red, Frame -> True, AspectRatio -> 1, ImageSize -> 400, 
    PlotRangePadding -> {{10, 10}, {1, 1}}][{5}, 1, 10] 
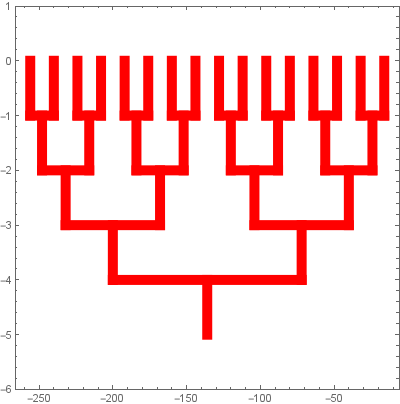
enter image description here

dendrogramF[Red, Frame->True, AspectRatio -> 1, ImageSize -> 400,
    PlotRangePadding->{{10, 10},{5, 5}}][{5}, 10, 10]
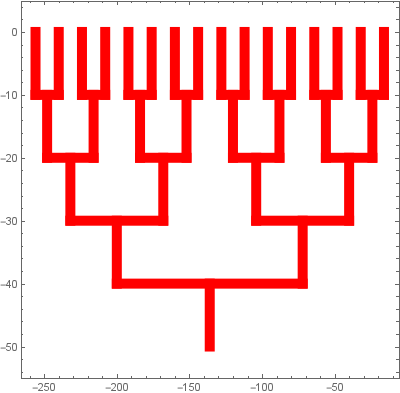
enter image description here

$\endgroup$
1
$\begingroup$
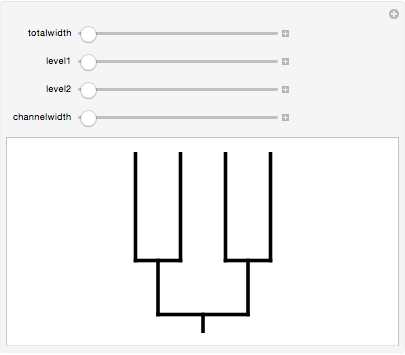
Manipulate[
 Graphics[{Thickness[channelwidth], 

   Line[{{0, 0}, {0, level1}}],
   Line[{{-totalwidth/4, level1}, {totalwidth/4, level1}}],

   Line[{{-3 totalwidth/8, level2}, {-totalwidth/8, level2}}],
   Line[{{totalwidth/8, level2}, {3 totalwidth/8, level2}}],

   Line[{{-totalwidth/4, level1}, {-totalwidth/4, level2}}],
   Line[{{totalwidth/4, level1}, {totalwidth/4, level2}}],

   Line[{{-3 totalwidth/8, level2}, {-3 totalwidth/8, 1}}],
   Line[{{-totalwidth/8, level2}, {-totalwidth/8, 1}}],

   Line[{{totalwidth/8, level2}, {totalwidth/8, 1}}],
   Line[{{3 totalwidth/8, level2}, {3 totalwidth/8, 1}}]

   },
 PlotRange -> {{-1, 1}, {0, 1}}],
 {totalwidth, 1, 2},
 {level1, .1, .3},
 {level2, .4, .8},
 {channelwidth, .01, .03}
 ]

enter image description here

The lines could be generated algorithmically rather than explicitly listed, of course.

$\endgroup$
1
  • $\begingroup$ Thanks, but I was rather looking for a method to generate the points/lines and also be able to generalize the method to any number of levels. $\endgroup$
    – Niki
    Commented Apr 8, 2017 at 20:57

Your Answer

By clicking “Post Your Answer”, you agree to our terms of service and acknowledge you have read our privacy policy.

Not the answer you're looking for? Browse other questions tagged or ask your own question.