I am trying to approximate the derivative of a function from its Chebyshev expansion.
I start out with the following random function:
In[4]:= f[x_] = -4.1261 + .99213*x - 0.562172*x^2 - 3.7120 x^3 + 3.06508*x^4
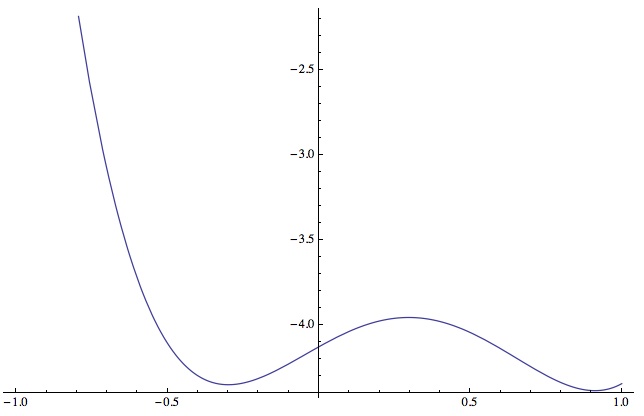
Which looks like

Now I try the Chebyshev approximations as follows:
In[105]:= cgs = 5

In[107]:= Clear[A, a]

In[108]:= A = Array[a, cgs + 1, {0}]

Out[108]= {a[0], a[1], a[2], a[3], a[4], a[5]}

In[109]:=   a[0] = (1/Pi)* Integrate[(f[x]* ChebyshevT[0, x]/Sqrt[1-
x^2]), {x, -1, 1}]

Out[109]= -3.25778

In[110]:= For[i = 1, i <= cgs, i++,  a[i] = (2/Pi)*Integrate[(f[x]*
ChebyshevT[i, x]/Sqrt[1 - x^2]), {x, -1, 1}]]

In[111]:= A

Out[111]= {-3.25778, -1.79187, 1.25145, -0.928, 0.383135, -1.97901*10^-15}

In[113]:= cf = Table[a[i]*ChebyshevT[i, x], {i, 0, cgs}]

Out[113]= {-3.25778, -1.79187 x, 1.25145 (-1 + 2 x^2), -0.928 (-3 x + 4
x^3), 0.383135 (1 - 8 x^2 + 8 x^4), -1.97901*10^-15 (5 x - 20 x^3 + 16 x^5)}

In[115]:= CF[x_] = Sum[cf[[i]], {i, 1, cgs + 1}]

Out[115]= -3.25778 - 1.79187 x + 1.25145 (-1 + 2 x^2) - 0.928 (-3 x + 4 x^3)
+ 0.383135 (1 - 8 x^2 + 8 x^4) -  1.97901*10^-15 (5 x - 20 x^3 + 16 x^5)

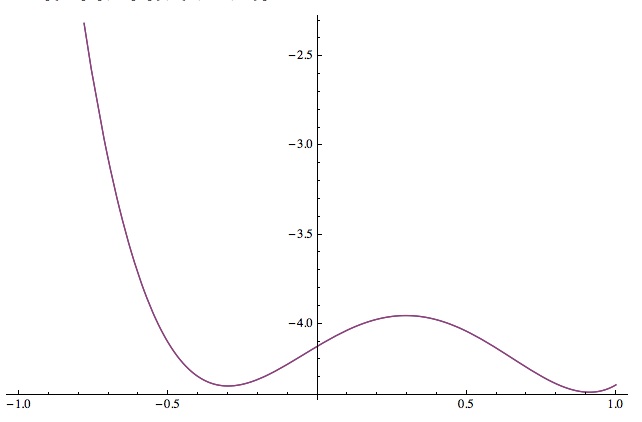
Plot[{CF[x], f[x]}, {x, -1, 1}]
gives

So I think I have done everything correctly up until now, because I cannot see a difference between the two graphs.
As for the derivative approximation, I use the discussion in Numerical Recipes section 5.9.
First I take the derivative of f[x]
In[200]:= df[x_] = D[f[x], x]

Out[200]= 0.99213 - 1.12434 x - 11.136 x^2 + 12.2603 x^3

In[201]:= A

Out[201]= {-3.25778, -1.79187, 1.25145, -0.928, 0.383135, -1.97901*10^-15}

In[236]:= Clear[dA, da]

In[237]:= dA = Array[da, cgs + 1, {0}]

Out[237]= {da[0], da[1], da[2], da[3], da[4], da[5]}
Now I use equation (5.9.2)
In[273]:= da[cgs] = da[cgs - 1] = 0;

In[275]:= For[i = 4, i >= 1, i--, da[i - 1] = 2*(i)*a[i] + da[i + 1]]
to get
In[276]:= dA

Out[276]= {-9.15174, 8.0709, -5.568, 3.06508, 0, 0}

In[277]:= dcf = Table[da[i]*ChebyshevT[i, x], {i, 0, cgs}]

Out[277]= {-9.15174, 8.0709 x, -5.568 (-1 + 2 x^2), 3.06508 (-3 x + 4 x^3),
0, 0}

In[278]:= dCF[x_] = Sum[dcf[[i]], {i, 1, cgs + 1}]

Out[278]= -9.15174 + 8.0709 x - 5.568 (-1 + 2 x^2) + 3.06508 (-3 x + 4 x^3)

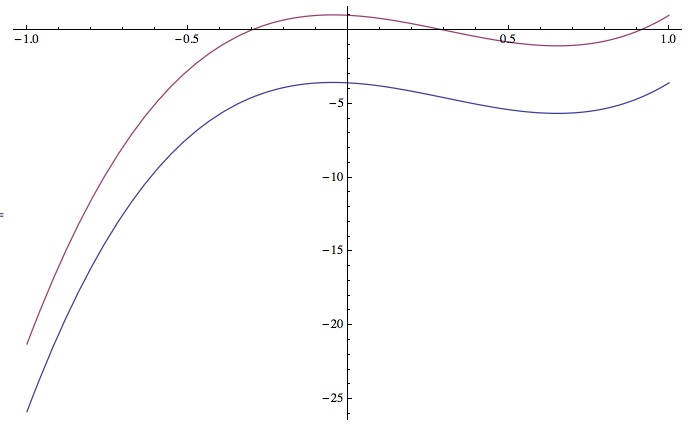
Plot[{dCF[x], df[x]}, {x, -1, 1}]
which gives

which is clearly not the same graph. I was able to figure out that the problem is in the constant term. Namely, it is twice the value it should be. To test this idea I created the test function
In[279]:=  test[x_] = -9.151740000000007`/2 + 8.070896000000015` x -
5.568000000000007` (-1 + 2 x^2) + 3.065080000000011` (-3 x + 4 x^3);
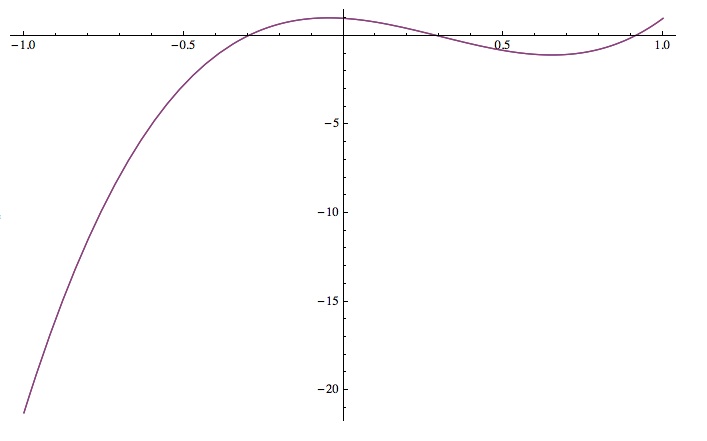
and plotted Plot[{test[x], df[x]}, {x, -1, 1}] to get

which shows that test is the same as f[x].
If anyone could help spot my mistake, that would be greatly appreciated.
