2
$\begingroup$

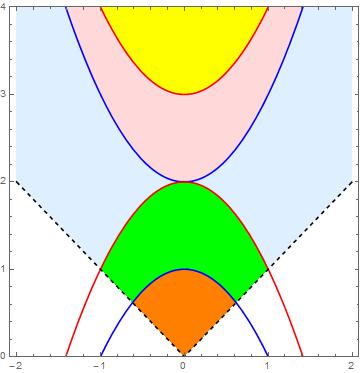
I have five curves {k^2 + 2, k^2 + 3, -k^2 + 2, -k^2 + 1, Sqrt[k^2]}, as seen below; how can I get rid of the blue and red ones inside the white region? Is there an option, like in DensityPlot, to specify plot region here to be above the black dashed curve?

Here's the code I used:

Plot[{k^2 + 2, k^2 + 3, -k^2 + 2, -k^2 + 1, Sqrt[  (k^2)], 
  6, -6}, {k, -2, 2}, Frame -> True, AspectRatio -> 1, 
 PlotRange -> {0, 4}, 
 Filling -> {2 -> {{6}, {Yellow}}, 2 -> {{1}, {LightRed}}, 
   1 -> {{3}, {LightBlue}}, 3 -> {{4}, {Green}}, 4 -> {{5}, {Orange}},
    5 -> {{7}, {White}}}, 
 PlotStyle -> {Blue, Red, Red, Blue, {Black, Dashed}}, 
 AxesOrigin -> {-2, 0}]

enter image description here

$\endgroup$
0

1 Answer 1

5
$\begingroup$

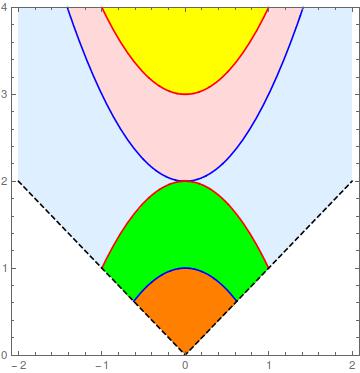
Use RegionFunction:

Plot[{k^2 + 2, k^2 + 3, -k^2 + 2, -k^2 + 1, Sqrt[k^2], 4.1}, {k, -2, 
  2}, Frame -> True, AspectRatio -> 1, PlotRange -> {0, 4}, 
 Filling -> {4 -> {{5}, Orange}, 4 -> {{3}, Green}, 3 -> {{5}, Green},
    3 -> {{1}, LightBlue}, 5 -> {{1}, LightBlue}, 
   1 -> {{2}, LightRed}, 2 -> {{6}, Yellow}}, 
 PlotStyle -> {Blue, Red, Red, Blue, {Black, Dashed}}, Axes -> False, 
 RegionFunction -> Function[{x, y}, Sqrt[x^2] <= y]]

enter image description here

I also cleaned the Filling.

$\endgroup$
0

Your Answer

By clicking “Post Your Answer”, you agree to our terms of service and acknowledge you have read our privacy policy.

Not the answer you're looking for? Browse other questions tagged or ask your own question.