8
$\begingroup$

Consider the two following similar expressions:

(* EXPRESSION 1 *)
Plot[Sin[x], {x, 0, 2 Pi}, Frame -> True, PlotRange -> Automatic,
 PlotLabel -> Style["PLOT LABEL", FontSize -> Medium, FontWeight -> Bold]]

(* EXPRESSION 2 *)
Plot[Sin[x], {x, 0, 2 Pi}, Frame -> True, PlotRange -> Automatic, PlotRangePadding -> 0,
PlotLabel -> Style["PLOT LABEL", FontSize -> Medium, FontWeight -> Bold]]

the only difference between them being the PlotRangePadding -> 0 option.

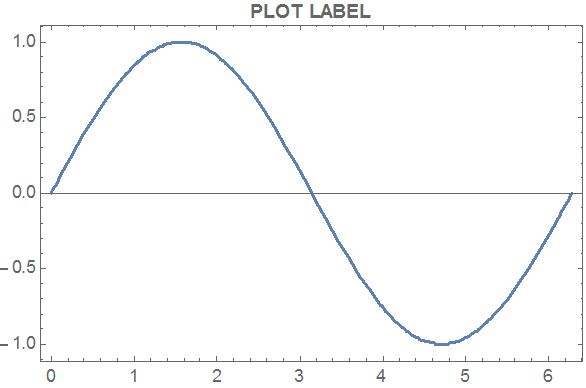
The first expression produces this result:

Result of expression 1

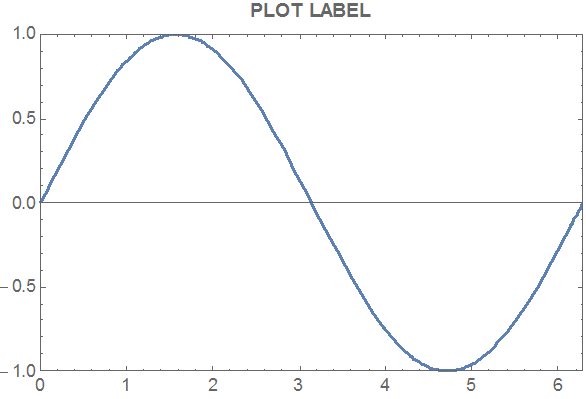
while the second one returns the following image:

Result of expression 2

As you can see, the distance of the text "PLOT LABEL" is different in each case.

I guess that the distance between the plot label and the plot does not take into account the plot padding. Why is this happening? How can I avoid this behaviour? More precisely, how can I increase the distance between the plot label and the plot in case 1?

In case it matters, I am using Mathematica 10.4.1 running on Windows 7.

$\endgroup$
5
  • $\begingroup$ The closest I get is to use Labeled[plot, Style["PLOT LABEL", {"Graphics", "GraphicsLabel", FontSize -> Medium, FontWeight -> Bold}], Top], but it is centered along the image center line, not the Graphics center line (subtle, but noticeable). The Alignment option could be used to further adjust it, but I don't have the time at the moment. $\endgroup$
    – rcollyer
    Commented Sep 13, 2016 at 14:35
  • $\begingroup$ @rcollyer Thank you. Using Labeled is an option, of course. But I wonder whether or not it is possible to have a more consistent/coherent behaviour of the PlotLabel option. $\endgroup$
    – Vicent
    Commented Sep 13, 2016 at 14:46
  • 1
    $\begingroup$ PlotLabel is fairly low-level, i.e. it is handled by the renderer itself, so you have to get "creative". Here's something that works quite well: PlotLabel -> Pane[Style["PLOT LABEL", FontSize -> Medium, FontWeight -> Bold], {Automatic, 20}, Alignment -> {Center, Top}]. Let me know if that works for you, and I'll convert it to an answer. $\endgroup$
    – rcollyer
    Commented Sep 13, 2016 at 14:52
  • $\begingroup$ @rcollyer It almost works for me. The result when NOT using PlotRangePadding -> 0 is now acceptable but still different to that obtained when using PlotRangePadding -> 0. I have a pair of charts, one of each type, and I would like the corresponding labels to be the same distance from their respective chart. Anyway, you can post it as an answer, and we can wait and see. $\endgroup$
    – Vicent
    Commented Sep 13, 2016 at 15:06
  • $\begingroup$ I also encounter this problem, i find that it is affected by the major ticks, if the largest major ticks is not equal to the plot range, this will happen $\endgroup$
    – fairytale
    Commented Apr 4, 2020 at 21:59

3 Answers 3

8
$\begingroup$

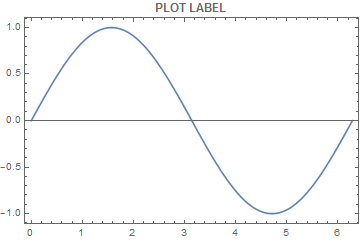
You may use ImagePadding and Scaled. Also note that you should not need PlotRange -> Automatic as this is the default for the y-axis in Plot.

Plot[Sin[x], {x, 0, 2 Pi},
 Frame -> True,
 PlotLabel -> Style["PLOT LABEL", FontSize -> Medium, FontWeight -> Bold],
 ImagePadding -> {{Automatic, Automatic}, {Automatic, Scaled[0.0025]}}]

Mathematica graphics

You may try different values for the Scaled parameter to see which you prefer by using Manipulate.

Manipulate[
 Plot[Sin[x], {x, 0, 2 Pi},
  Frame -> True,
  PlotLabel -> 
   Style["PLOT LABEL", FontSize -> Medium, FontWeight -> Bold],
  ImagePadding -> {{Automatic, Automatic}, {Automatic, Scaled[p]}}],
 {{p, .005}, 0, .1}
 ]

enter image description here

Hope this helps.

$\endgroup$
4
$\begingroup$

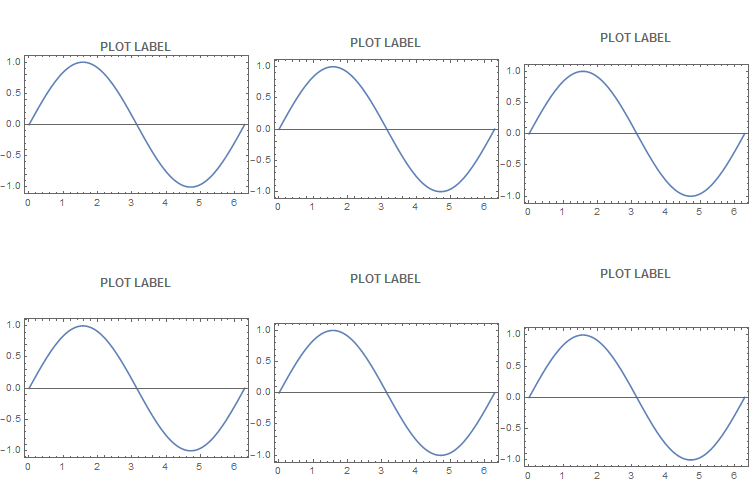
A trick I have used is to put the label in an invisible frame and then monkey with the bottom frame margin. The following produces four plots using this trick, one with no space and three with 4, 8, and 12 printer points, respectively, between the label and the plot frame.

Column[
  Plot[Sin[x], {x, 0, 2 Pi},
    Frame -> True,
    PlotLabel ->
      Style[
        Framed["PLOT LABEL",
          ContentPadding -> False,
          FrameStyle -> Transparent,
          FrameMargins -> {{0, 0}, {#, 0}}],
      12, Bold]]& 
  /@ Subdivide[0, 12, 3]]

plots

$\endgroup$
1
  • 1
    $\begingroup$ An invisible frame - sounds like a Pane to me. $\endgroup$
    – Karsten7
    Commented Sep 14, 2016 at 22:36
3
$\begingroup$

I'll provide a workaround for setting an arbitrary distance dist between the PlotLabel and the plot itself.

A way to introduce dist is to replace "PLOT LABEL" with

Framed["PLOT LABEL 1", FrameStyle -> White,
FrameMargins -> {{Automatic, Automatic}, {dist, 0}}]

For example:

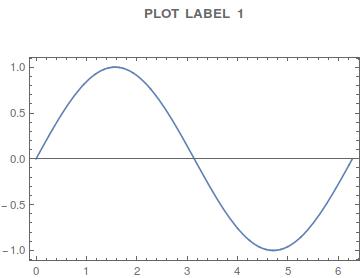
a big distance (dist=30):

a = Plot[Sin[x], {x, 0, 2 Pi}, Frame -> True, PlotRange -> Automatic, 
  PlotLabel -> 
   Style[Framed["PLOT LABEL 1", FrameStyle -> White, 
     FrameMargins -> {{Automatic, Automatic}, {30, 0}}], 
    FontSize -> Medium, FontWeight -> Bold]]

enter image description here

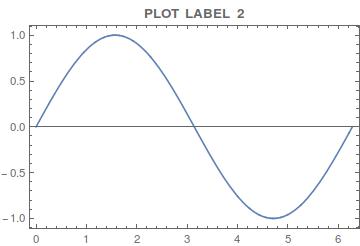
a small distance (dist=-2):

b = Plot[Sin[x], {x, 0, 2 Pi}, Frame -> True, PlotRange -> Automatic, 
  PlotLabel -> 
   Style[Framed["PLOT LABEL 2", FrameStyle -> White, 
     FrameMargins -> {{Automatic, Automatic}, {-2, 0}}], 
    FontSize -> Medium, FontWeight -> Bold]]

enter image description here

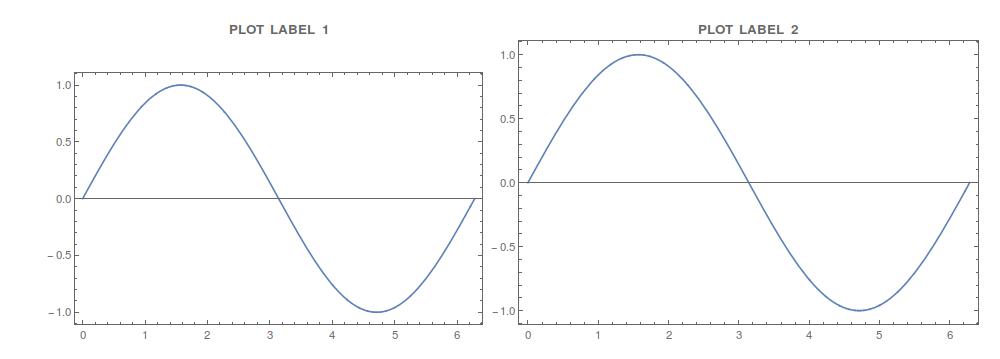
It's also decent with GraphicsRow:

c = GraphicsRow[{a, b}, ImageSize -> 1000, Spacings -> -40]

enter image description here

Maybe not very elegant, but it works.

$\endgroup$

Your Answer

By clicking “Post Your Answer”, you agree to our terms of service and acknowledge you have read our privacy policy.

Not the answer you're looking for? Browse other questions tagged or ask your own question.