1
$\begingroup$

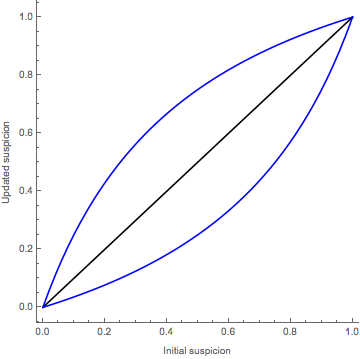
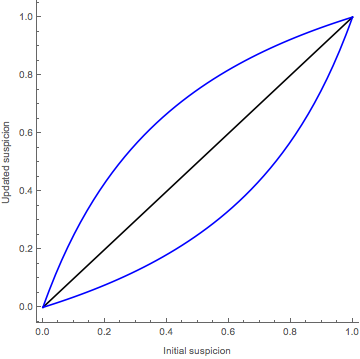
I'm trying to do something that should be fairly straightforward: having a vertical y-axis label. My problem is, it creates a ridiculously large space between the label and the axis (exactly what I'm trying to avoid). Here's my code, inspired from answers to previous questions, and the result.

Labeled[Plot[
    {p, p/(Exp[1.1]*(1-p)+p),p*Exp[1.1]/(1+p*(Exp[1.1]-1))},
    {p,0,1},
    PlotStyle->{Black ,Blue,Blue},
    AxesOrigin -> {0, 0},
    AspectRatio->1,
    ImageMargins -> 0
  ],
  {"Initial suspicion","Updated suspicion"},
  {Bottom, Left},
  RotateLabel->True
]

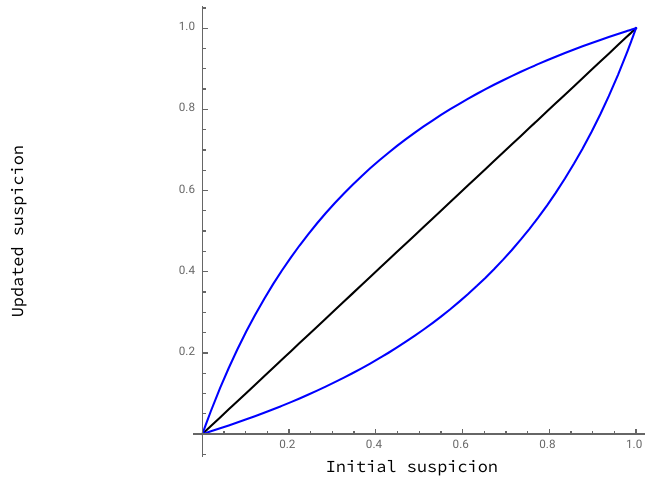
plot with very large space between y-axis and label

Things I tried: using a Frame (doesn't work and breaks the style of axes), add zero or negative Spacings (same result), using Rotate["updated suspicion", 90 Degree] instead of RotateLabel->True (same result). Now I'm out of ideas, even though it feels like this should be simple.

$\endgroup$
1
  • $\begingroup$ Welcome to Mma.SE. Start by taking the tour now and learning about asking and what's on-topic. Always edit if improvable, show due diligence, give brief context, include minimal working example of your code and data in formatted form. By doing all this you help us to help you and likely you will inspire great answers. The site depends on participation, as you receive give back: vote and answer questions, keep the site useful, be kind, correct mistakes and share what you have learned. $\endgroup$
    – rhermans
    Commented Aug 13, 2018 at 16:09

3 Answers 3

3
$\begingroup$

If you don't like the frame around everything, you can specify the sides. With FrameLabel, the labeling you want can be done easily:

Plot[{p, p/(Exp[1.1]*(1 - p) + p), 
  p*Exp[1.1]/(1 + p*(Exp[1.1] - 1))}, {p, 0, 1}, 
 PlotStyle -> {Black, Blue, Blue}, AxesOrigin -> {0, 0}, 
 AspectRatio -> 1, ImageMargins -> 0, 
 FrameLabel -> {"Initial suspicion", "Updated suspicion"}, 
 Frame -> {{True, False}, {True, False}}]

Mathematica graphics

$\endgroup$
1
  • $\begingroup$ Your command didn't give me exactly this graphic (on Wolfram Programming Lab), the ticks were gone. Adding FrameTicks -> All solved it, and I also added PlotRangePadding -> 0 to fix the fact that the plot no longer starts at the origin. Thanks! $\endgroup$
    – Ted
    Commented Aug 14, 2018 at 12:21
1
$\begingroup$

I typically do use FrameLabel for this.

Plot[{p, p/(Exp[1.1]*(1 - p) + p), p*Exp[1.1]/(1 + p*(Exp[1.1] - 1))},
  {p, 0, 1}, PlotStyle -> {Black, Blue, Blue}, AxesOrigin -> {0, 0}, 
  AspectRatio -> 1, ImageMargins -> 0, 
  Frame -> {True, True, False, False}, 
  FrameLabel -> {"Initial suspicion", "Updated suspicion"}]

Mathematica graphics

$\endgroup$
1
$\begingroup$

I started by defining a region which is just a white rectangle. If you like, you can get a bounding box by uncommenting the EdgeForm:

p100 = Graphics[{(EdgeForm[Thick]), White, Rectangle[]}, AspectRatio -> 0.70, ImageSize -> 486]

Then, you just put stuff in it wherever you like:

Show [ p100, Inset[p1,{0.25,0.25}], Inset["X-Axis",0.50,0.20] ]

Here, p1 is some plot. You can make multipart figures this way, or annotate figures. When I made p1, I use the option FrameLabel->{"","Y-Axis"}

You have to do a little work with the numbers to place things where you want, but it's not hard. I work with the EdgeForm on while I'm making the figure, then I turn it off when I want to save the final product.

$\endgroup$

Your Answer

By clicking “Post Your Answer”, you agree to our terms of service and acknowledge you have read our privacy policy.

Not the answer you're looking for? Browse other questions tagged or ask your own question.