First, define
data = Flatten[
  Table[{x, y, z, -N@HeavisidePi[1.1 x]}, {x, -1, 1, 0.1}, {y, -1, 1,
    1}, {z, -1, 1, 1}], 2]
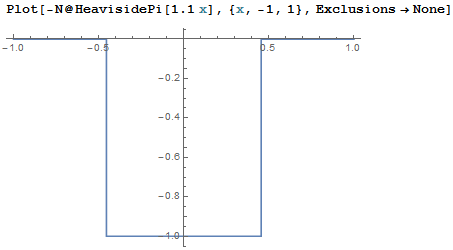
In which I used -N@HeavisidePi[1.1 x], its plot is
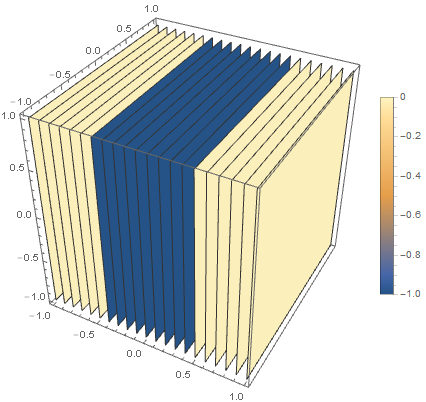
If I plot this
ListSliceDensityPlot3D[data, {"XStackedPlanes", Subdivide[-1, 1, 20]},
  PlotLegends -> Automatic]
This will gives
This is right.
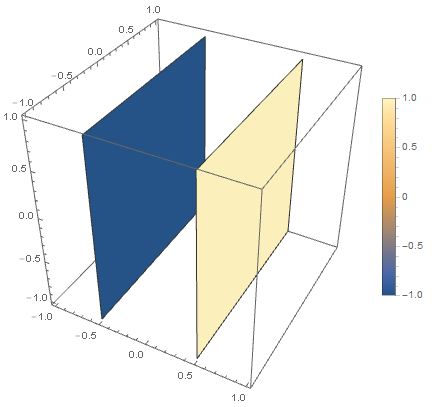
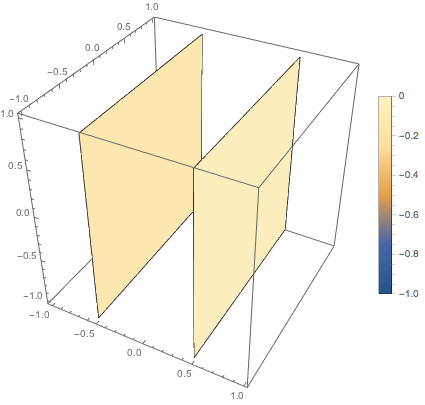
However If I plot only two surface at x=-0.5 and x=0.5
ListSliceDensityPlot3D[data, {"XStackedPlanes", {-0.5, 0.5}},
 PlotLegends -> Automatic]
This will give wrong plot
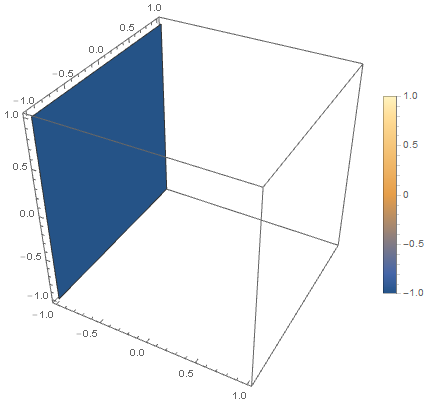
Only plot one surface is also not right.
ListSliceDensityPlot3D[data, {"XStackedPlanes", {-1}},
 PlotLegends -> Automatic]
What is wrong?
I am using Mathematica 10.4.0.0

Table[]though, that works. $\endgroup$Table[]? $\endgroup$ListSliceDensityPlot3Dis designed for these circumstances, but I'd report it as a bug. $\endgroup$