6
$\begingroup$

I'm having some trouble getting the labels right in a SciDraw figure. More precisely, I want labels at half-integer multiples of $\pi$, and I want them as clean inline fractions (i.e. as $\pi/2$ and not $\frac{\pi}{2}$. So far, what I've found works best is to get the numerator and denominator separately and then join them as strings,giving something like

Plot[
 Cos[ωt]^2
 , {ωt, -0.3, 2 π + 0.3}
 , Frame -> True
 , FrameTicks -> {{None, None}, {
    Function[{#,
       Style[
        StringReplace[
         ToString[Numerator[Rationalize[#/π]]] <> "π/" <> 
          ToString[Denominator[Rationalize[#/π]]]
         , {"/1" -> "", "1π" -> "π", "0π" -> "0"}]
        , FontSize -> 30
        ]
       }] /@ Range[0, 2 π, π/2]
    , None}}
 ]
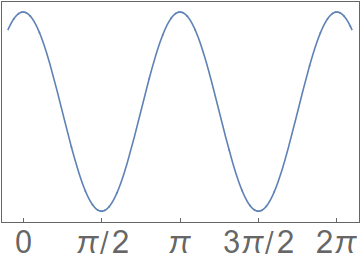
Mathematica graphics

If I do this in SciDraw, though, using the XTicks and LinTicks specifications,

Figure[
 FigurePanel[{
   FigGraphics[
     Plot[Cos[ωt]^2, {ωt, -0.3, 2 π + 0.3}]
     ];
   }
  , XPlotRange -> {-0.3, 2 π + 0.3}
  , XTicks -> LinTicks[-2 π, 2 π, π/2, 1, TickLabelFunction ->
     Function[
      Style[
       StringReplace[
        ToString[Numerator[Rationalize[#/π]]] <> "π/" <> 
          ToString[Denominator[Rationalize[#/π]]]
        , {"/1" -> "", "1π" -> "π", "0π" -> "0"}]
       , FontSize -> 30
       ]
      ]
    ]
  ]
 , CanvasSize -> {5, 3}
 ]

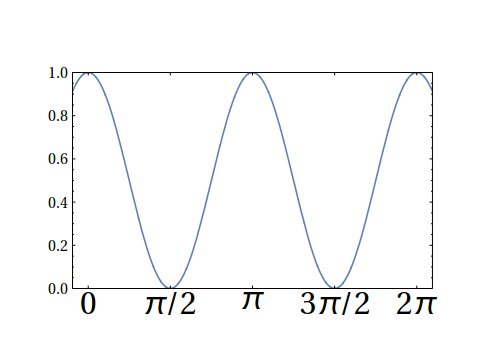
the output doesn't quite look right:
Mathematica graphics

In particular, note the incorrect positioning of the label at $\pi$. \[SadSmiley]. So:

  • Is there a way to get SciDraw to place these ticks correctly?
  • (Why is it doing it anyway?)
  • Am I barking up the wrong tree with these string replacements, i.e. is there a simpler way to produce this output?
$\endgroup$

1 Answer 1

7
$\begingroup$

Try setting TextPadding -> True. It does more or less the same as the builtin ContentPadding. It is described in SciDrawGuide.pdf.


What ContentPadding -> True does, in simple terms, is that it makes the enclosing box have a vertical size equal to a full line height. Otherwise the box has the same height as the enclosed character/text. SciDraw positions textual elements wrapped in boxes. For good alignment it is necessary that all boxes have the same height. This is done by enforcing a minimum line height. MaTeX also has such an option, precisely for dealing with this kind of problem.


Example:

<< SciDraw`

labelFun[x_, _] := 
  Module[{frac = Rationalize[x/Pi] Pi, num, den},
    num = Numerator[frac];
    den = Denominator[frac];
    If[den == 1,
      num,
      StringForm["``/``", num, den]
    ]
  ]

Figure[
 FigurePanel[{FigGraphics@Plot[Cos[ωt]^2, {ωt, 0, 2 π}];}, 
  XPlotRange -> {0, 2 π}, 
  XTicks -> LinTicks[-2 Pi, 2 Pi, Pi/2, 4, TickLabelFunction -> labelFun],
  TextPadding -> True,
  XExtendRange -> 0.02, YExtendRange -> 0.04
  ],
 CanvasSize -> {5, 3}]

I'm not sure what the best way is to get correct spacing around the / sign, but the following works: replace the string in StringForm with "\!\(TraditionalForm\```/``\)". This is a string representation of boxes. I obtained it by writing a single character into a string, selecting it, then pressing Command-Shift-T to convert it to TraditionalForm. This created a traditional form environment within the string. Then I deleted the character and typed what I wanted instead.

enter image description here

To set things such as font size, etc. use options such as FontSize, TickFontSize, XTickFontSize, etc., depending on how specific you want to be. It is not necessary to use Style here. These can also be set at the level of the Figure, as these options are inherited. Or you can use DefineStyle and re-use it across several figures. That's what I usually do when using SciDraw.

You may also be interested in the *TextNudge options, e.g. try XTickTextNudge -> -2 to position the ticks further from the frame. I tend to find the SciDraw default too tight.

$\endgroup$
3
  • $\begingroup$ Yeah, I figured. I'll just give you a few minutes to finalize it ;-). And now to try and get XTickFontFamily to use Latin Modern, before I give up and use MaTeX for the tick marks as well. $\endgroup$ Commented Jul 28, 2016 at 15:24
  • $\begingroup$ @EmilioPisanty I just added a note that MaTeX also has a ContentPadding option. Is is set to True by default, but it's good to be aware that this is absolutely necessary for such things... You could also set "DisplayStyle" -> False if you use MaTeX, then the fractions are not very tall anymore, and maybe you'll be happy with vertical fractions after all. BTW this can be done with Mathematica's typesetting as well, but I do not remember how. $\endgroup$
    – Szabolcs
    Commented Jul 28, 2016 at 15:25
  • 1
    $\begingroup$ @Szabolcs, how cool is that I could just push you over the 100K! Well done for those. Keep up the good work! $\endgroup$
    – user21
    Commented Jul 28, 2016 at 17:33

Your Answer

By clicking “Post Your Answer”, you agree to our terms of service and acknowledge you have read our privacy policy.

Not the answer you're looking for? Browse other questions tagged or ask your own question.